The Shift in China’s Growth Engine: From External Dependence to Domestic Scale
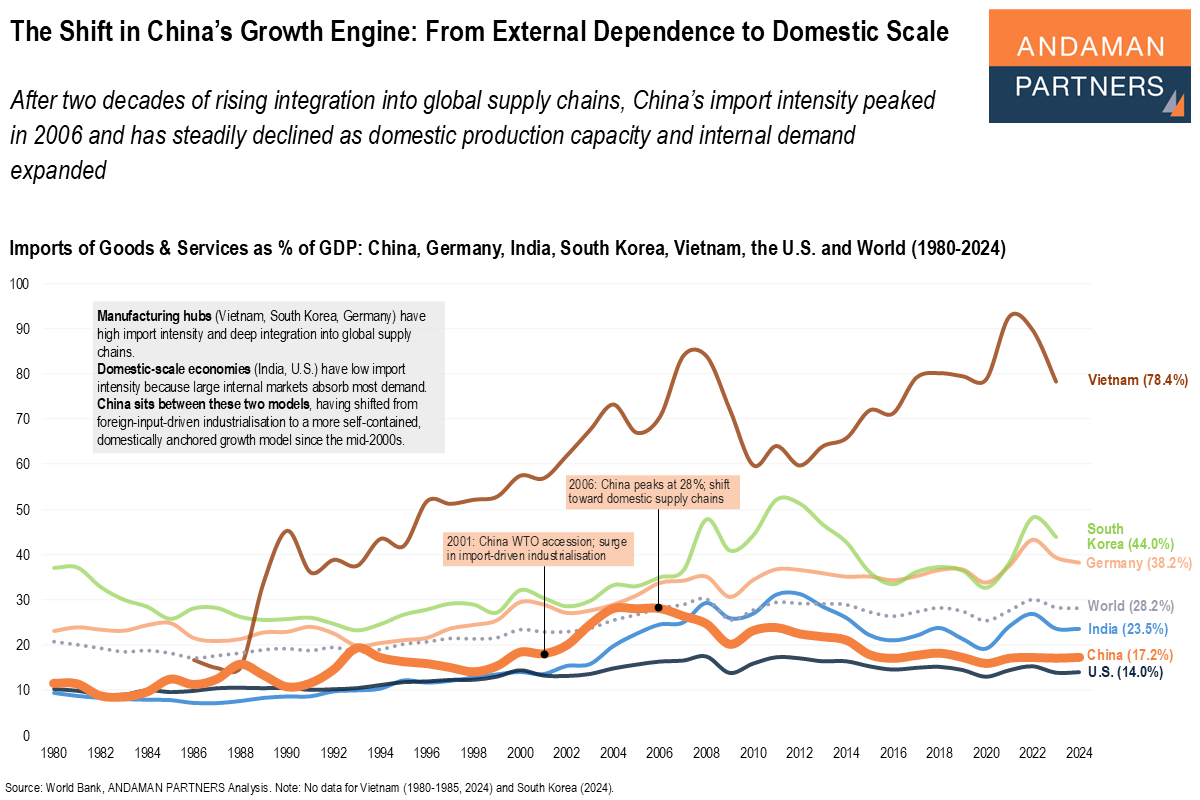
China’s import intensity peaked in 2006 and has steadily declined since then as domestic production capacity and internal demand expanded.
China’s import intensity peaked in 2006 and has steadily declined since then as domestic production capacity and internal demand expanded.
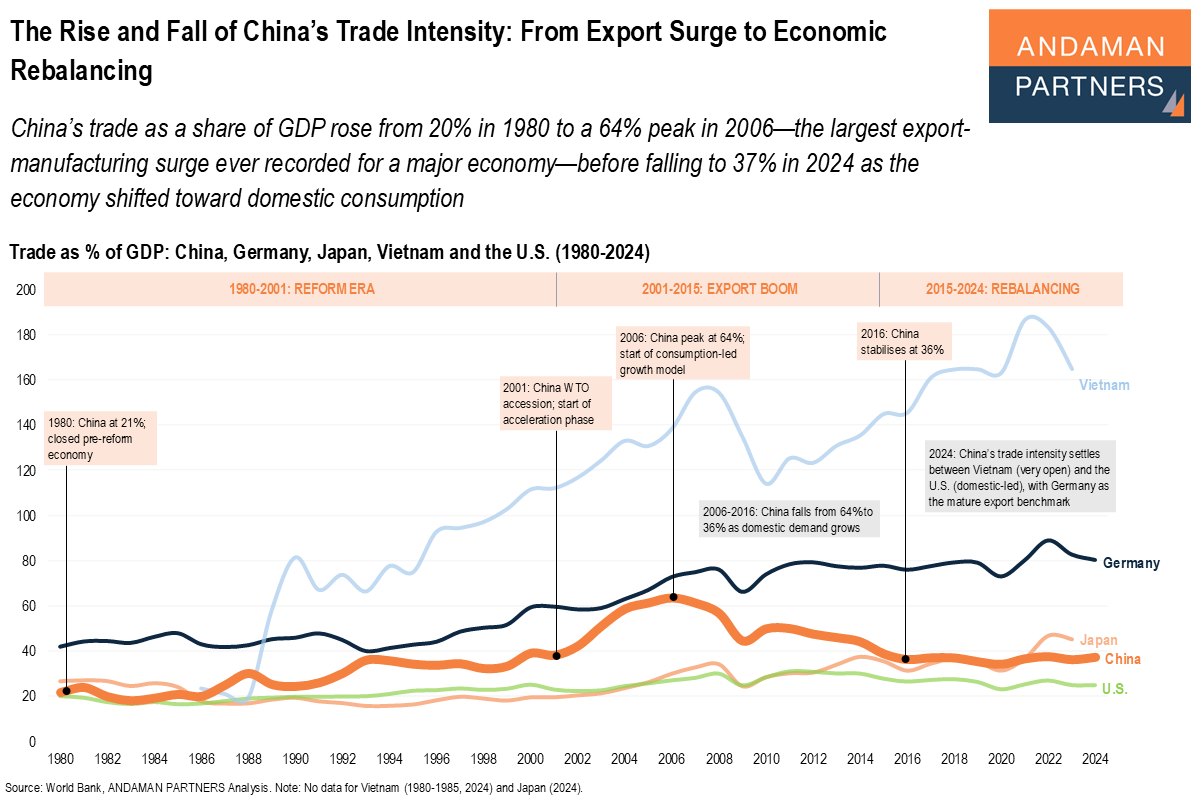
China’s trade as a share of GDP rose from 20% in 1980 to a peak of 64% in 2006 before falling to 37% in 2024 as the economy shifted toward domestic consumption.
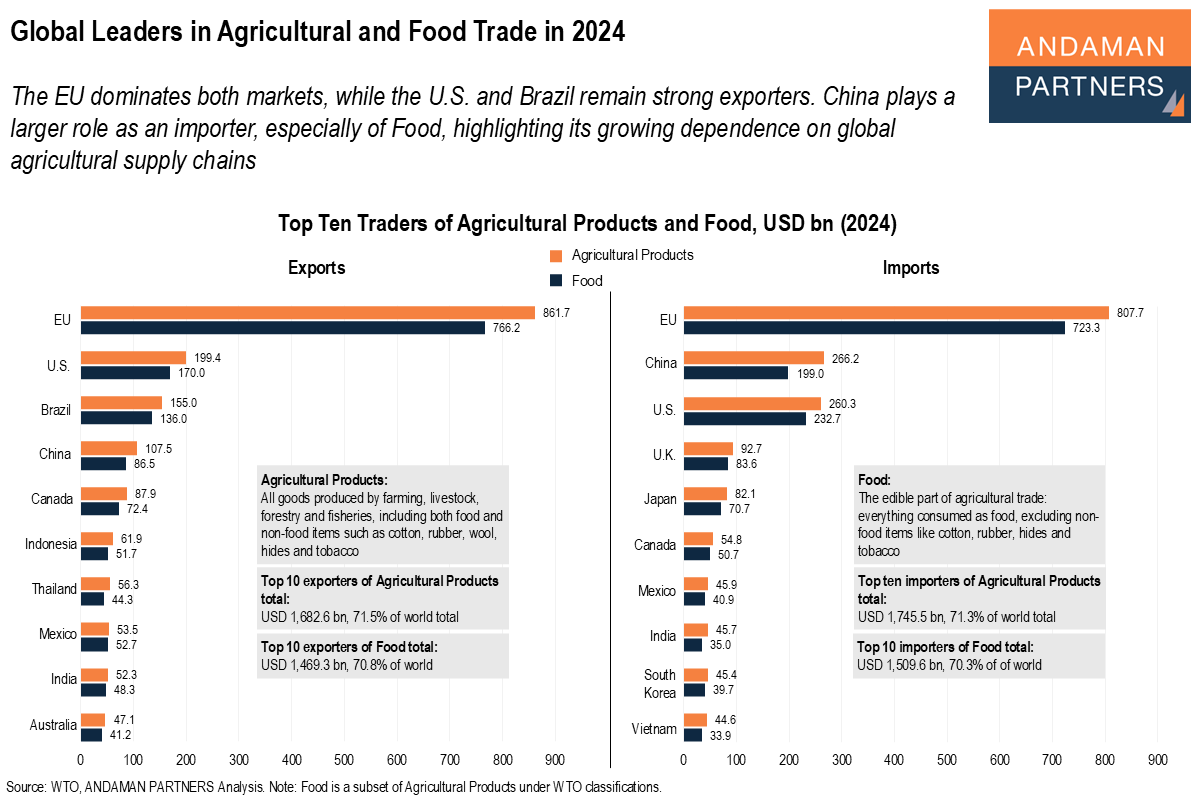
The EU dominates both markets, while the U.S. and Brazil remain strong exporters. China plays a larger role as an importer.
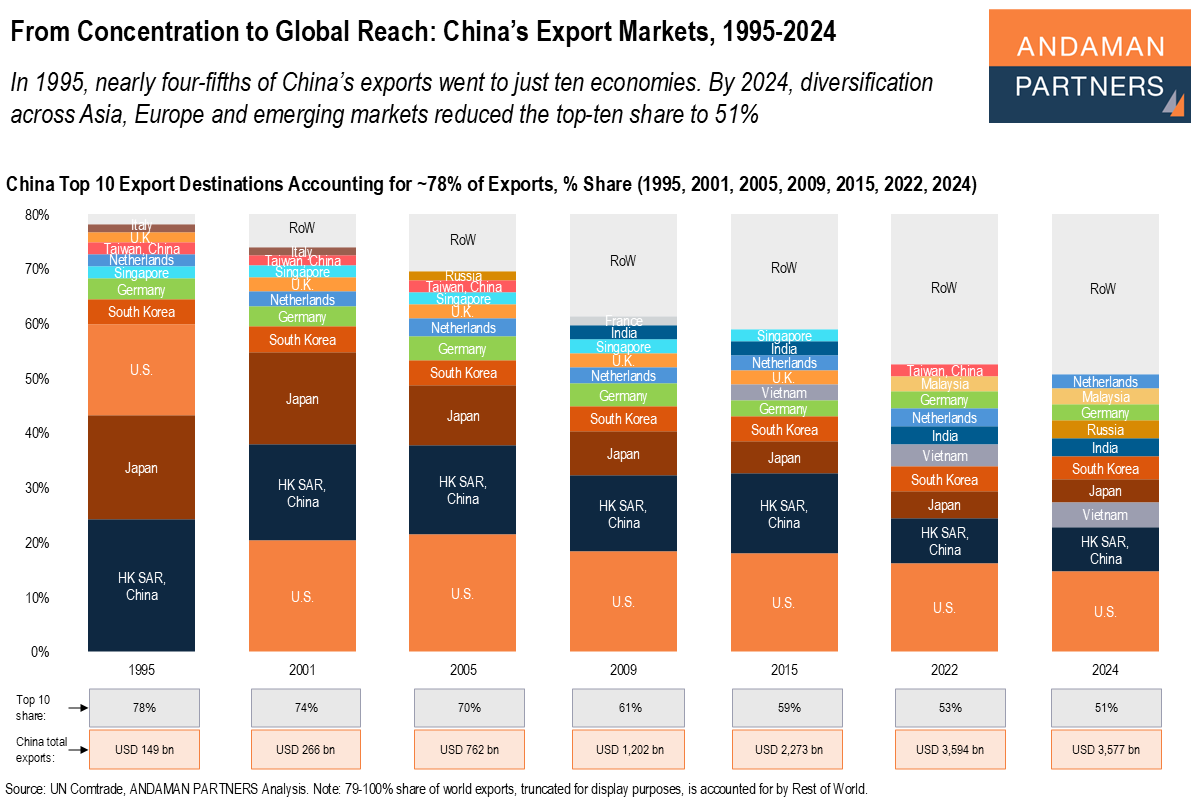
In 1995, nearly four-fifths of China’s exports went to just ten economies. By 2024, the top-ten's share was reduced to 51%.
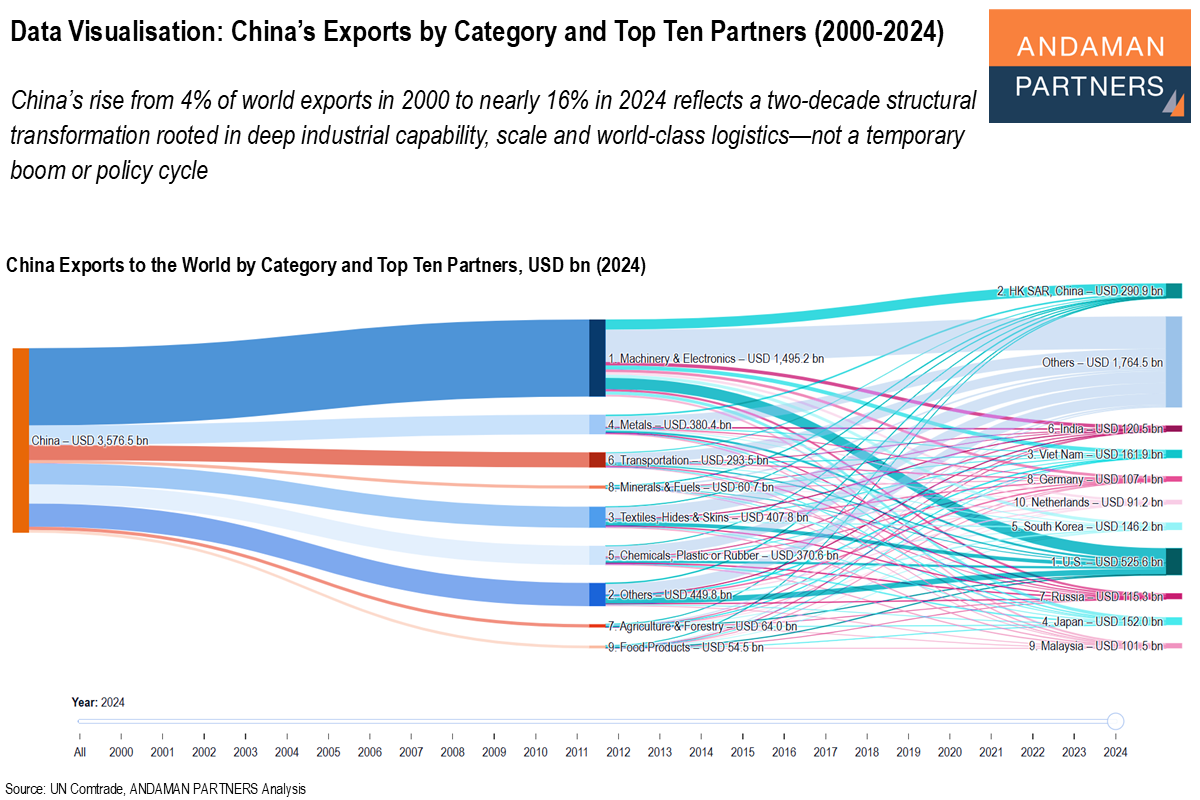
China’s rise from 4% of world exports in 2000 to nearly 16% in 2024 reflects a two-decade structural transformation.
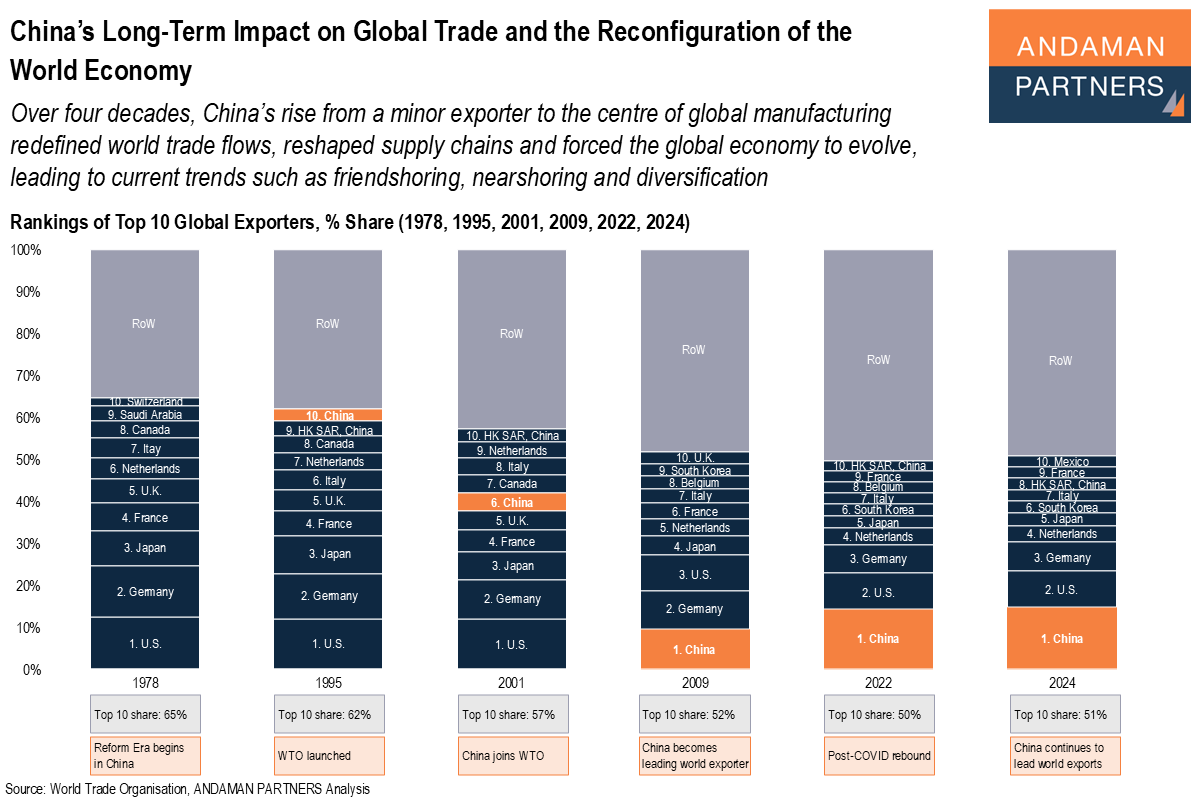
China’s rise from a minor exporter to the centre of global manufacturing redefined world trade flows, reshaped supply chains and forced the global economy to evolve.
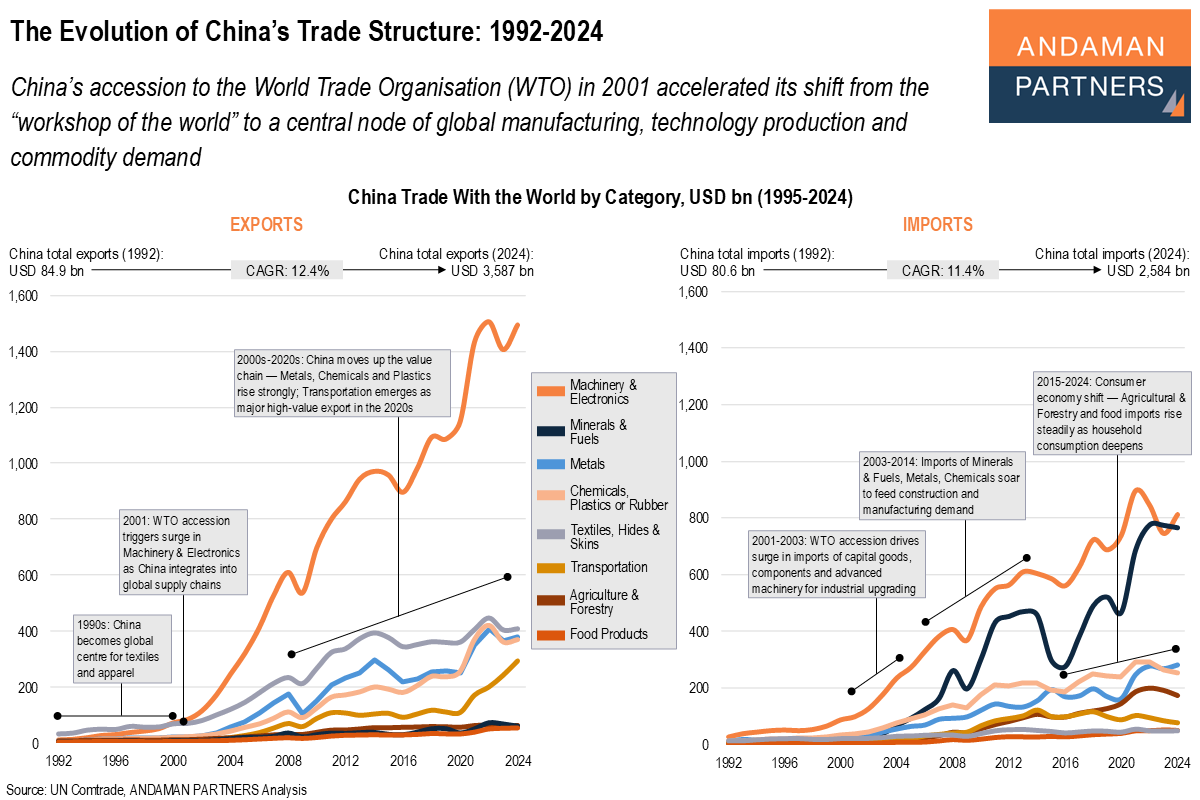
China’s accession to the WTO accelerated its shift from the “workshop of the world” to a central node of manufacturing, production and demand.
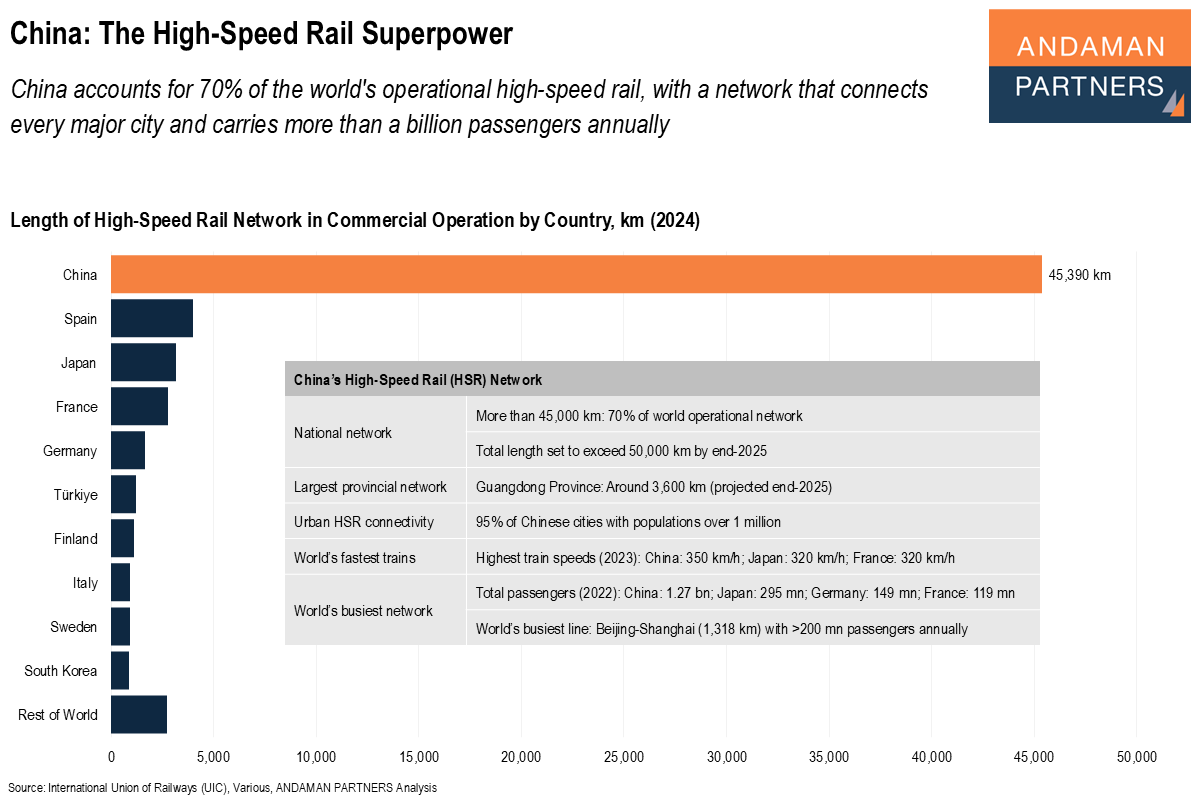
China accounts for 70% of the world's operational high-speed rail, with a network that connects every major city and carries a billion passengers.
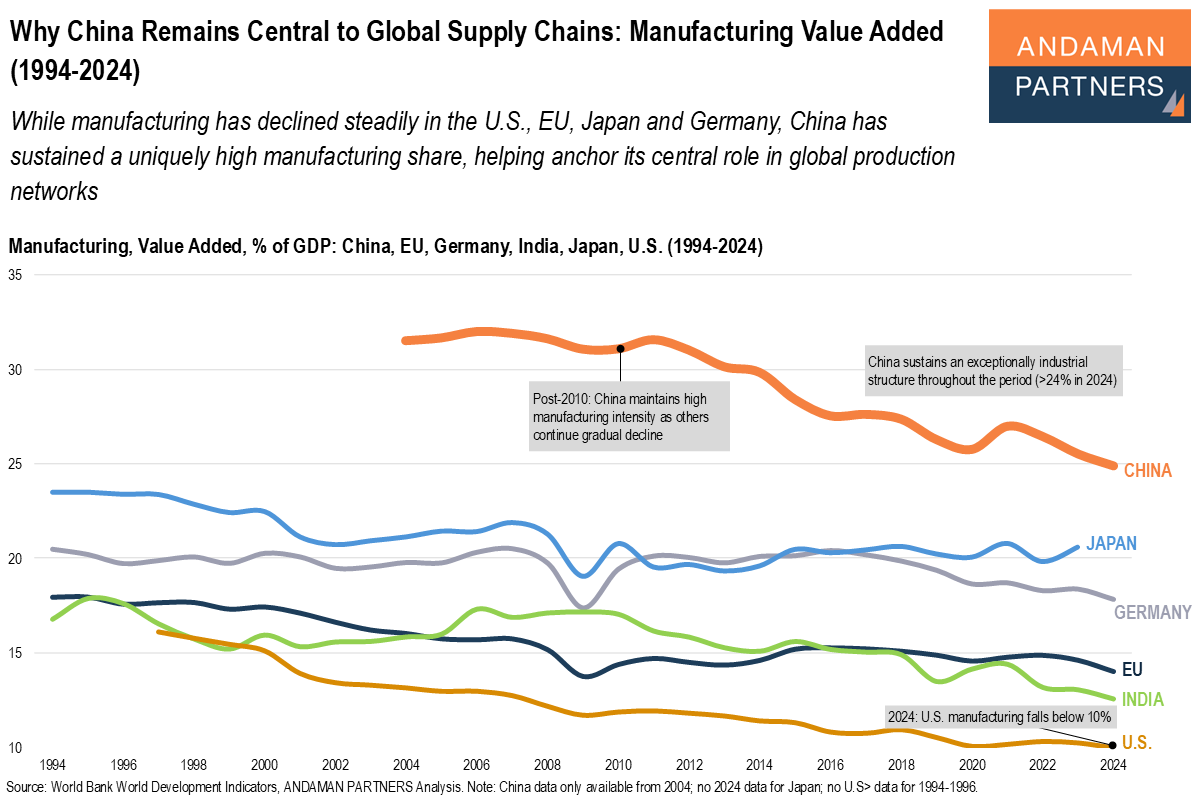
While manufacturing has declined steadily in the U.S., EU, Japan and Germany, China has sustained a uniquely high manufacturing share.
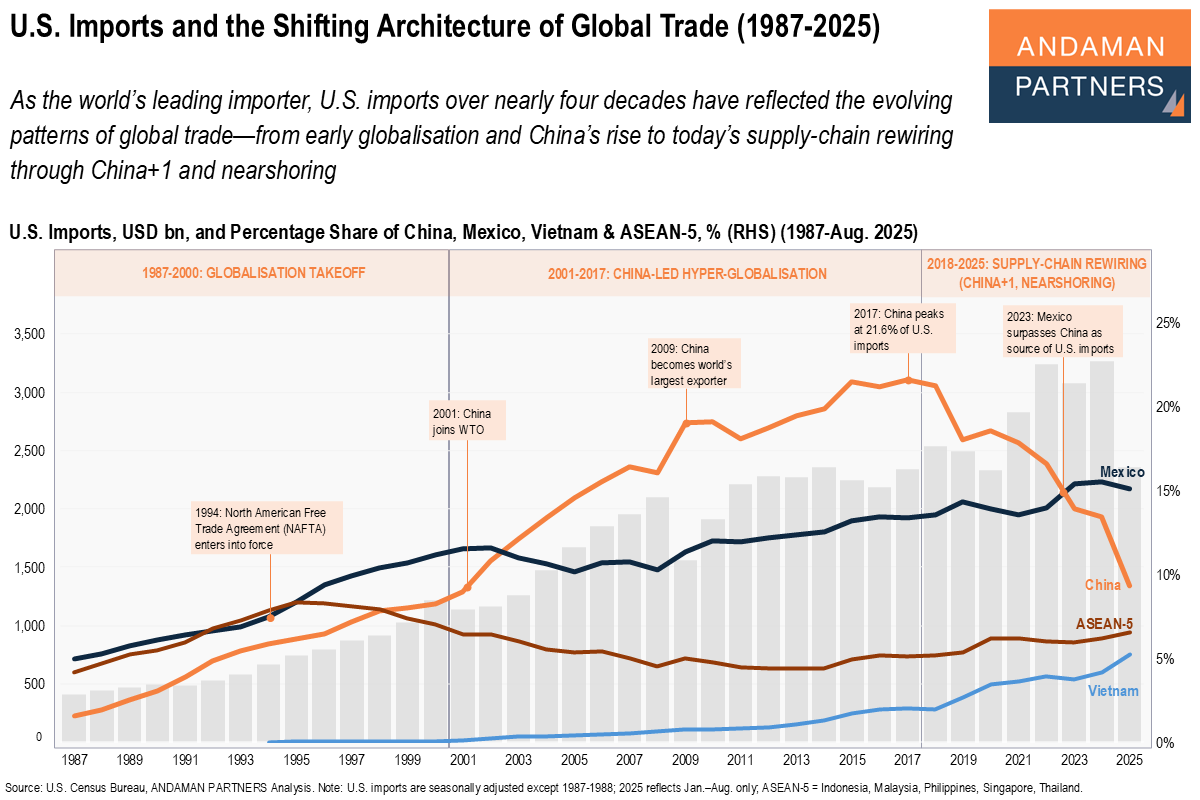
As the world’s leading importer, U.S. imports over nearly four decades have reflected the evolving patterns of global trade.