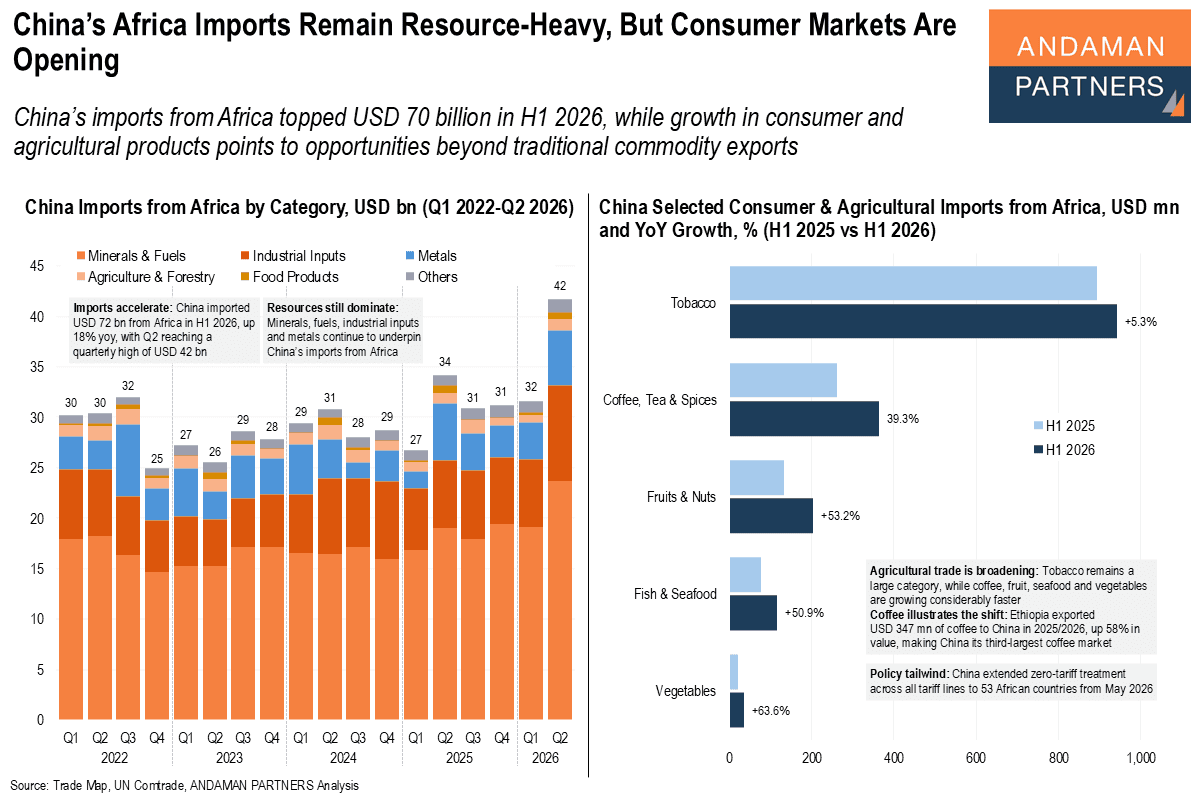
China’s Africa Imports Remain Resource-Heavy, But Consumer Markets Are Opening
China’s imports from Africa topped USD 70 billion in H1 2026, while consumer and agricultural products point to new opportunities for growth

China’s imports from Africa topped USD 70 billion in H1 2026, while consumer and agricultural products point to new opportunities for growth
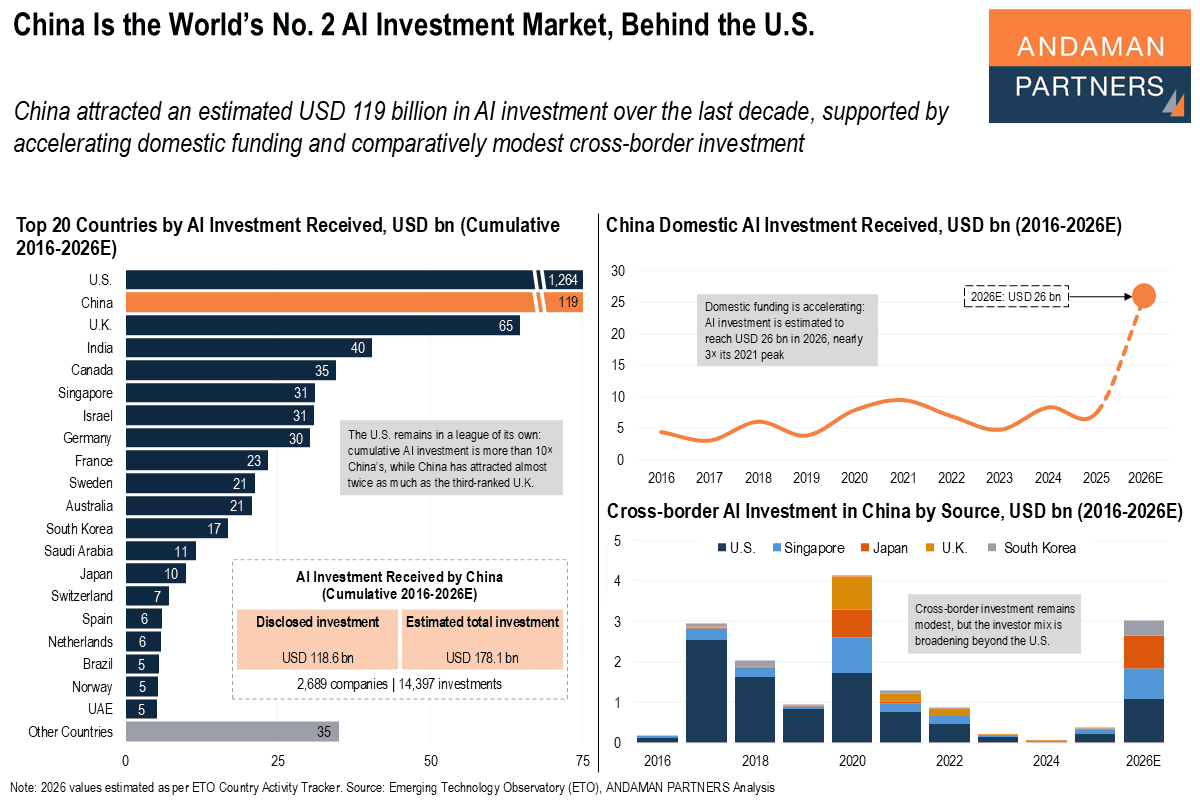
China attracted USD 119 billion in AI investment over the last decade, supported by accelerating domestic funding.
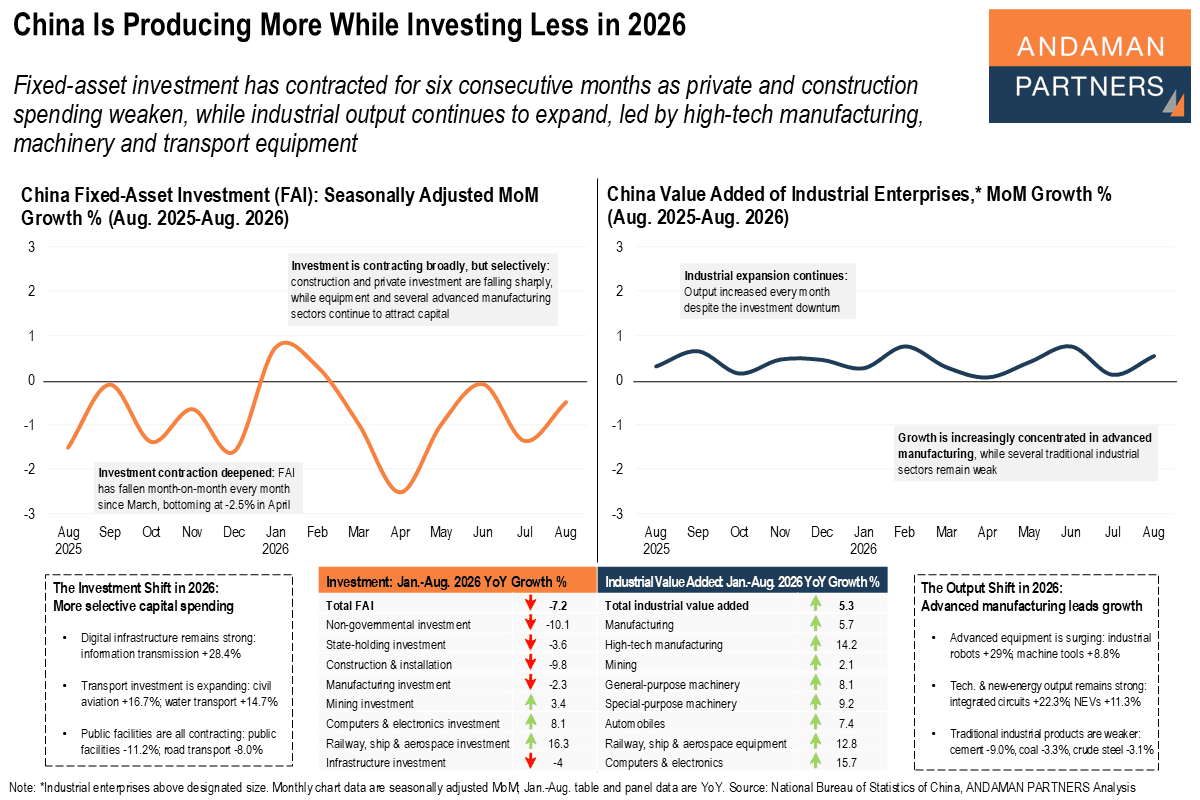
FAI has contracted for six consecutive months as private and construction spending weakens, while industrial output continues to expand.
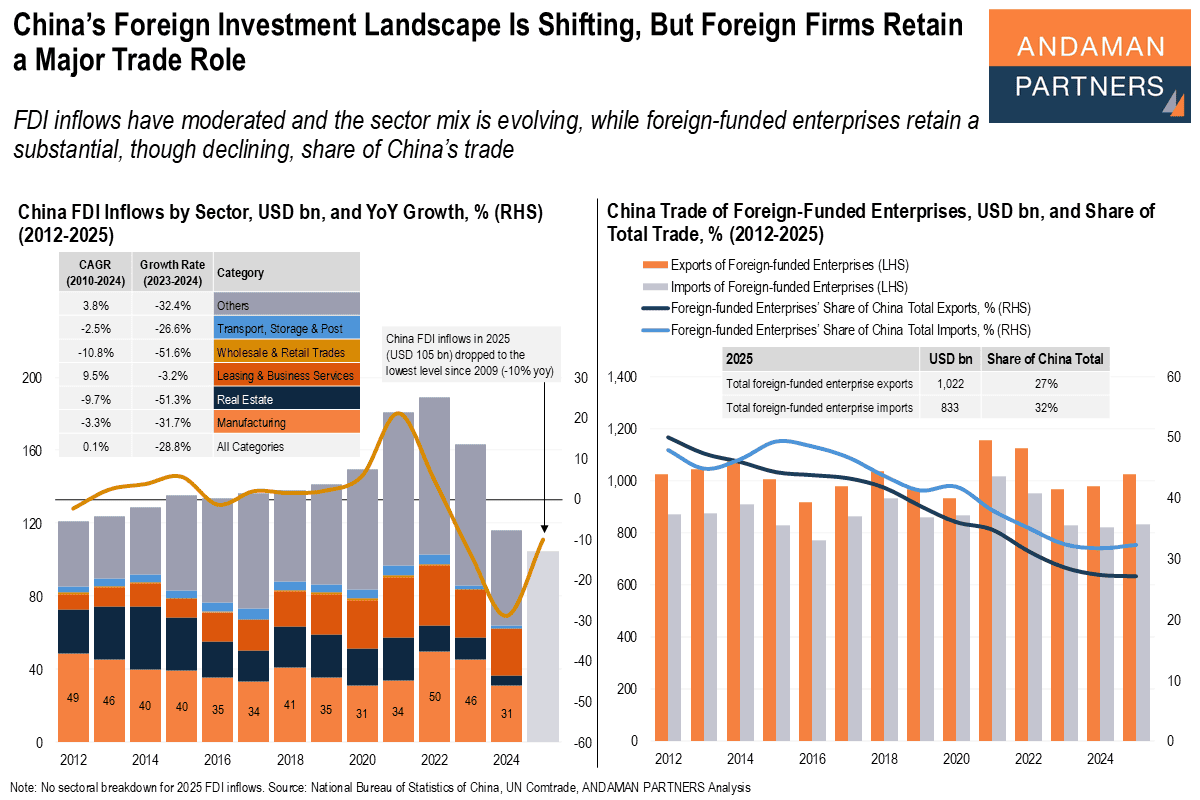
FDI inflows have moderated and the sector mix is evolving, while foreign-funded enterprises retain a substantial, though declining, share of China’s trade.
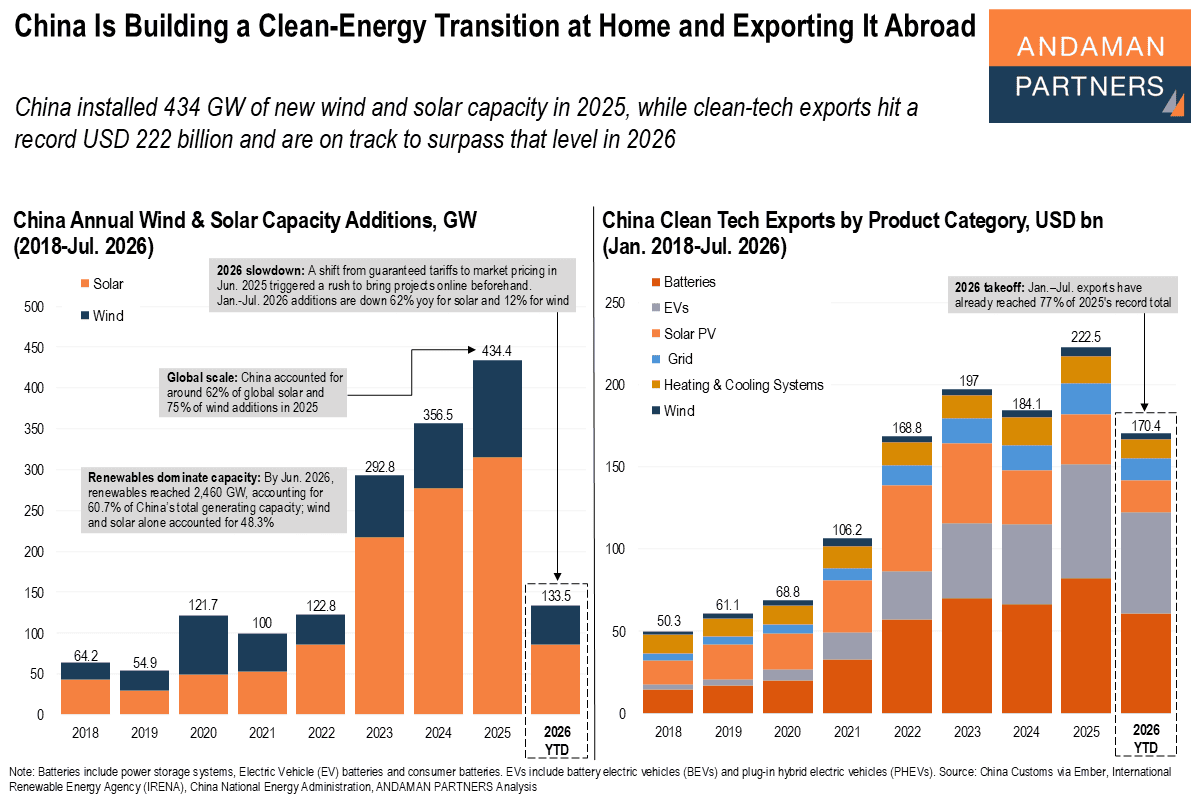
China installed 434 GW of new wind and solar capacity in 2025, while clean-tech exports hit a record level in 2026
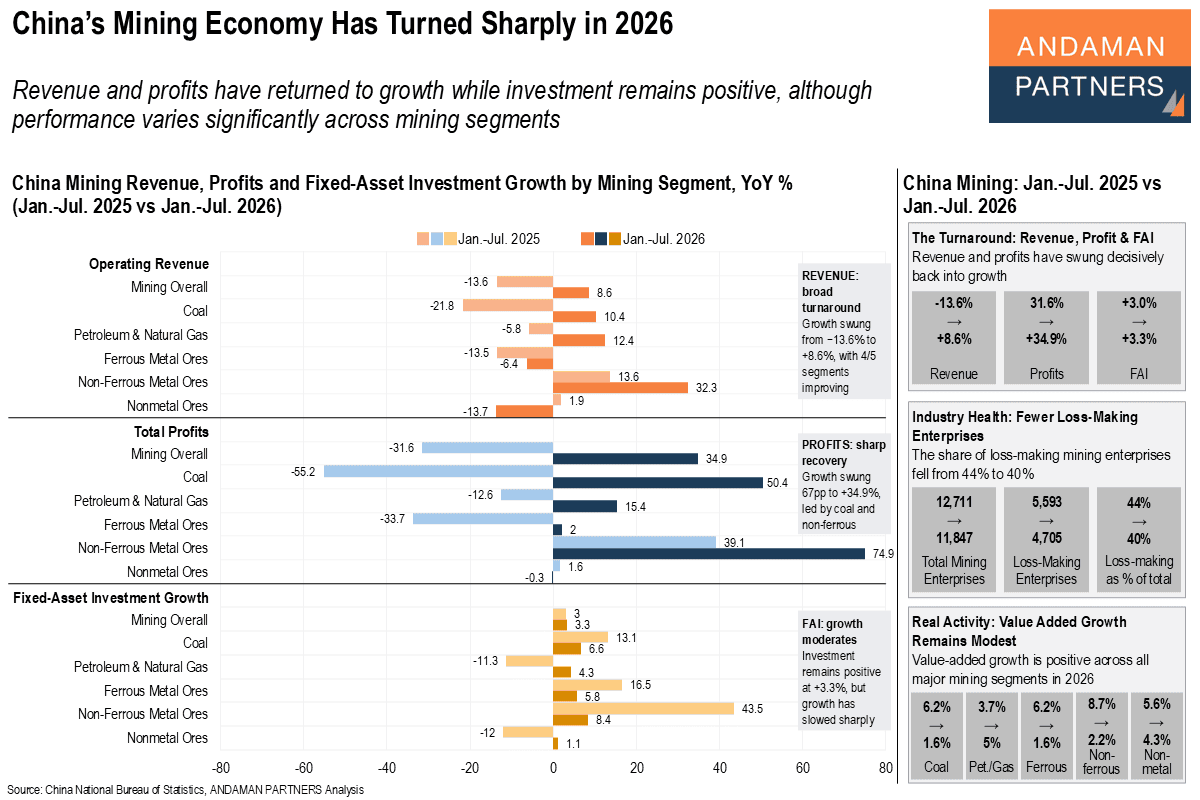
Revenue and profits have returned to growth while investment remains positive, although performance varies significantly across segments
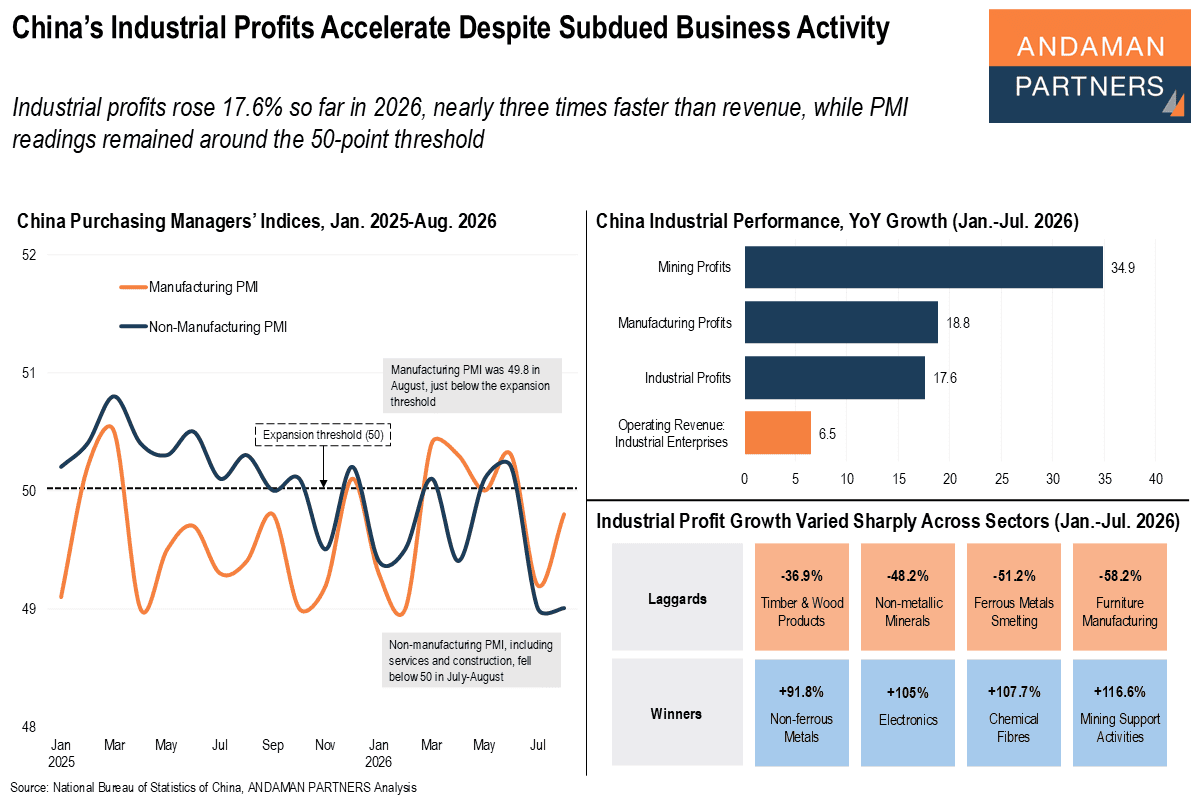
Industrial profits rose 17.6% so far in 2026, nearly three times faster than revenue, while PMI readings remained below 50
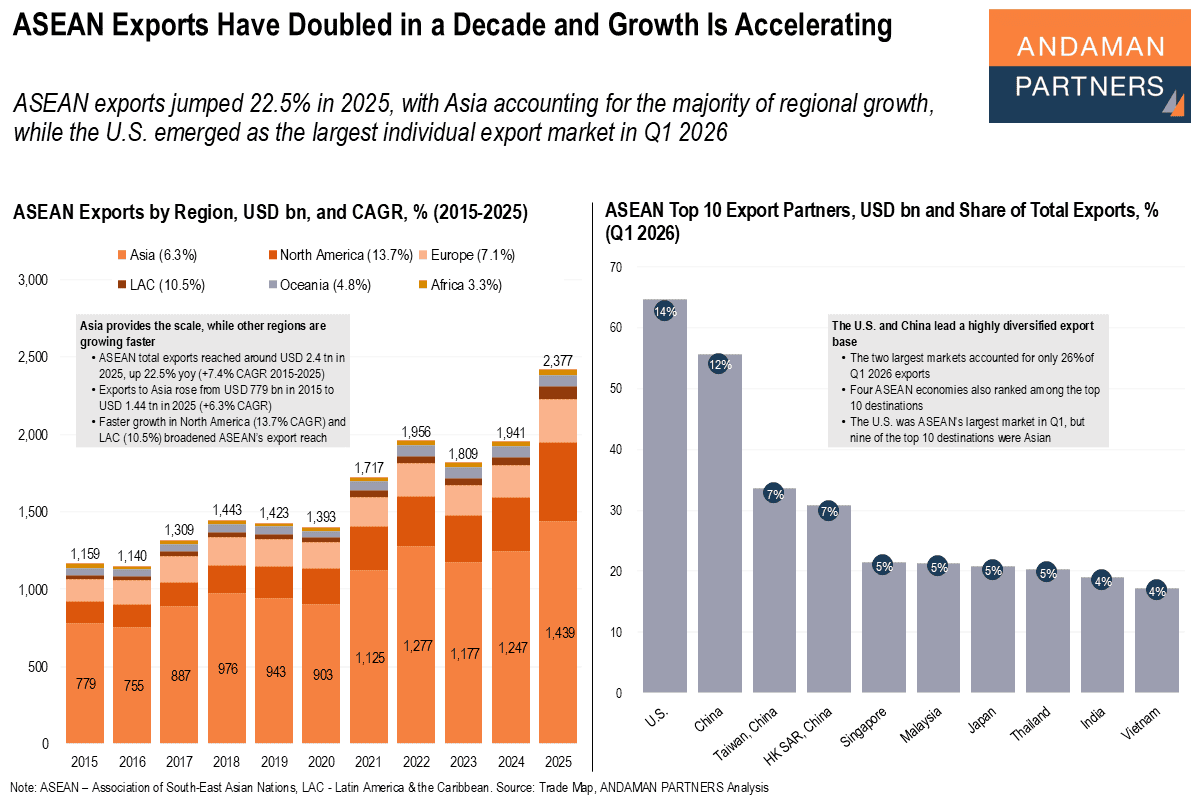
ASEAN exports jumped 22.5% in 2025, with Asia accounting for the majority of regional growth
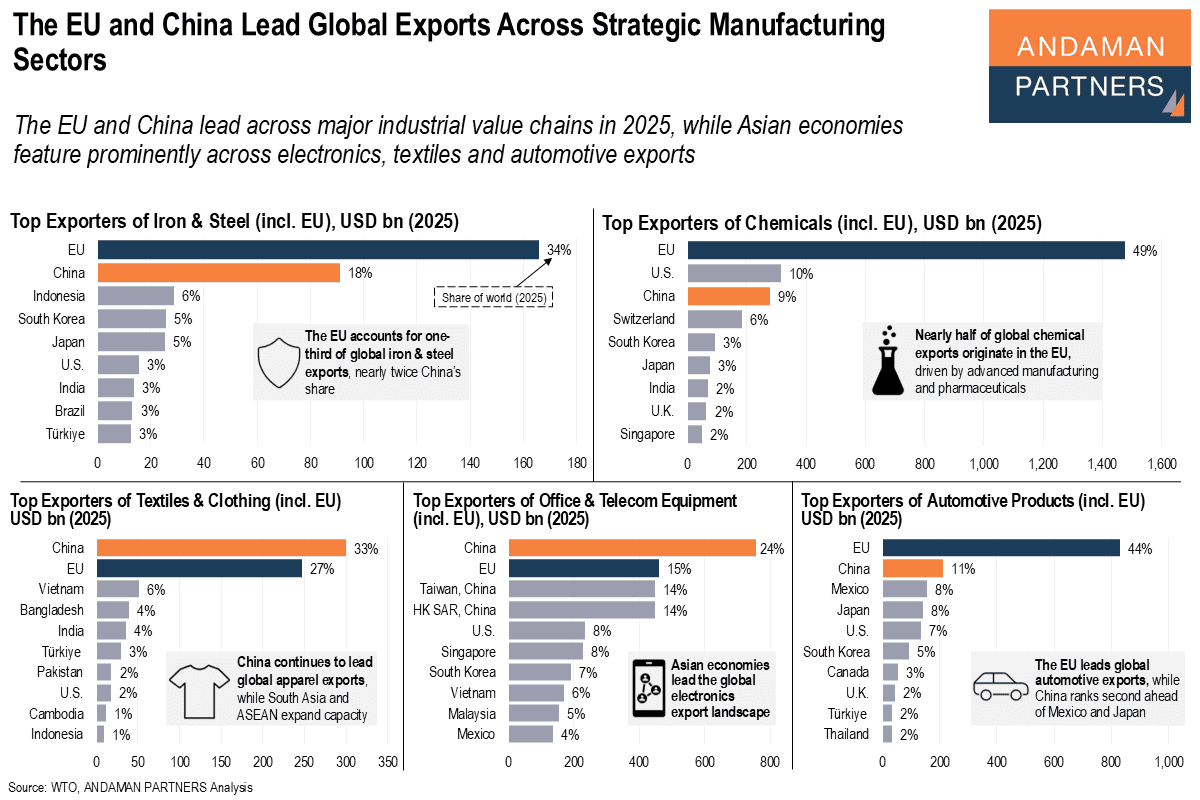
The EU and China lead across major industrial value chains in 2025, while Asian economies feature prominently in electronics, textiles and automotive
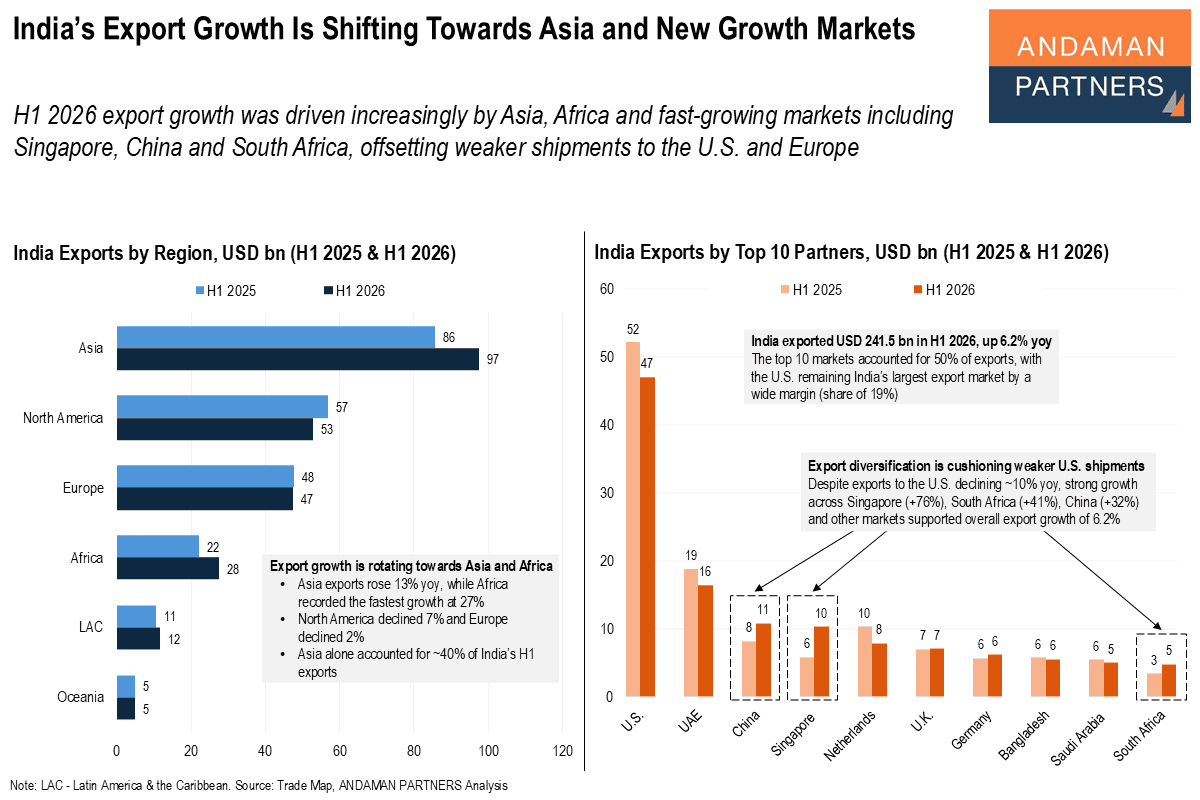
H1 2026 export growth was driven increasingly by Asia, Africa and fast-growing markets including Singapore, China and South Africa