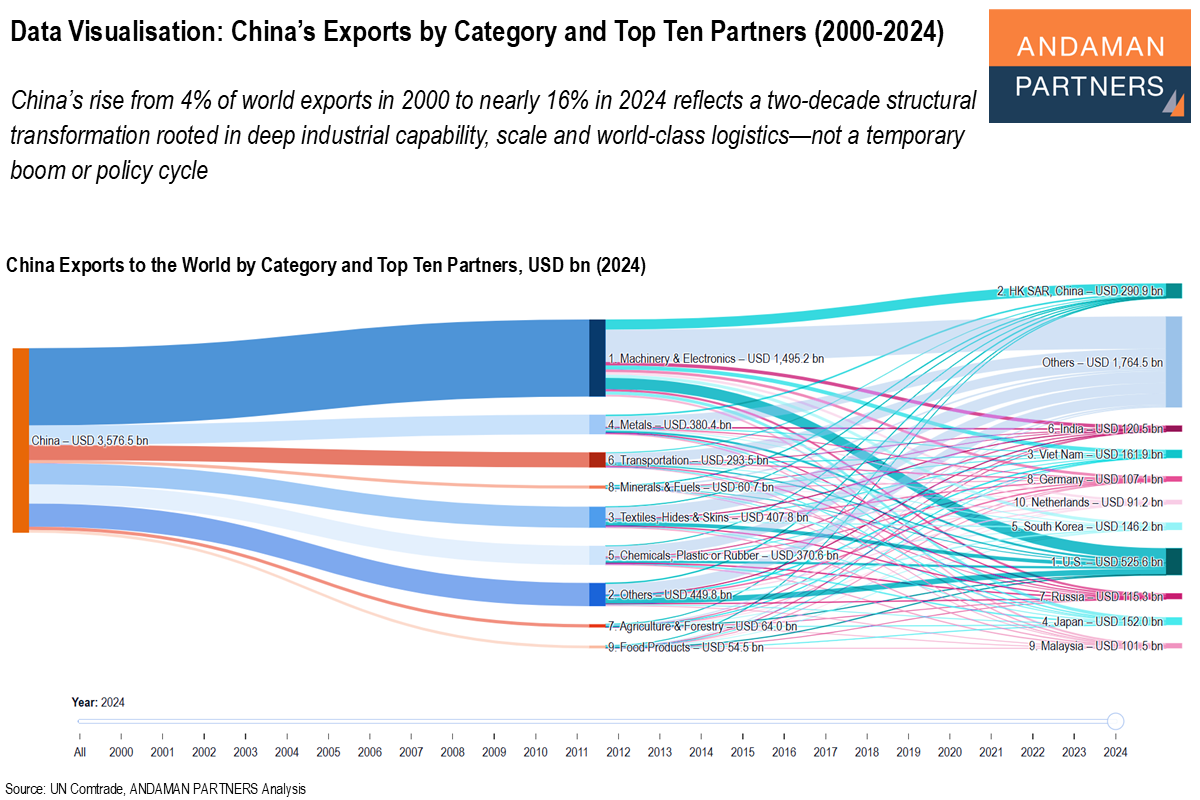
China’s rise from 4% of world exports in 2000 to nearly 16% in 2024 reflects a two-decade structural transformation rooted in deep industrial capability, scale and world-class logistics—not a temporary boom or policy cycle.
China’s export structure has long been anchored by Machinery & Electronics, which rose from roughly 30% of exports in 2001 to a stable 40-45% from the mid-2000s onward. In 2024, the category reached USD 1.50 trillion, accounting for 41.8% of national exports.
Over 2000-2024, Transportation was China’s fastest-growing category (15% CAGR), followed by Machinery & Electronics (13%), Chemicals (13%), Metals (12%) and Food Products (10%). By contrast, traditional labour-intensive sectors such as Textiles, Minerals & Fuels and Agriculture & Forestry posted more moderate growth of 7-8%.
The long-run sectoral shift is stark: Textiles fell from 27.6% of exports in 2000 to 11.4% in 2024, reflecting rising wages and China’s move into higher-value production. Transportation products, such as cars, electric vehicles (EVs) and ships, expanded from 3.7% of exports in 2000 to 8.2% in 2024, driven by automotive upgrading and the global spread of Chinese EVs and machinery.
China’s partner mix also changed profoundly. The U.S. has been China’s largest single-country market since 1999. Hong Kong, still the second-largest destination in 2024 with USD 292 billion (8.6%), functions mainly as a re-export and logistics gateway (around 99% of its merchandise exports are re-exports).
But since 2000, China’s export geography has become more diversified and more regional. As China’s coastal ports, inland logistics corridors and supply-chain linkages expanded, exports to Hong Kong and Japan declined, while flows to Southeast Asia (Vietnam, Malaysia, Thailand), South Asia (India) and newer hubs such as Mexico, the UAE and Russia rose sharply.
By 2024, after the U.S. and Hong Kong, China’s following four largest export markets were all in Asia (Japan, South Korea, Vietnam, India), each accounting for under 5% of total exports. Russia moved up to seventh place, while Germany and the Netherlands represented China’s key European destinations; Malaysia completed the top ten. Markets 11-20 span the Western Hemisphere (Mexico, Brazil), Europe (the U.K.), the Middle East (UAE) and Asia (Indonesia, the Philippines), underscoring China’s increasingly multipolar export footprint.
Also by ANDAMAN PARTNERS:
ANDAMAN PARTNERS supports international business ventures and growth. We help launch global initiatives and accelerate successful expansion across borders. If your business, operations or project requires cross-border support, contact connect@andamanpartners.com.

ANDAMAN PARTNERS Attended the Australia Governance Summit 2026 in Sydney
ANDAMAN PARTNERS Co-Founder Kobus van der Wath attended the Australia Governance Summit (AGS26) in Sydney, Australia.

ANDAMAN PARTNERS Wishes You a Happy and Prosperous Year of the Horse!
Compliments of the Chinese Lunar New Year to all our clients, customers, suppliers and partners.

ANDAMAN PARTNERS to Attend Investing in African Mining Indaba 2026 in Cape Town
ANDAMAN PARTNERS Co-Founders Kobus van der Wath and Rachel Wu will attend Investing in African Mining Indaba 2026 in Cape Town, South Africa.

Africa’s Industrial Leaders and Rising Manufacturing Economies
Morocco, South Africa and Egypt remain Africa’s leading industrial economies; DRC, Djibouti and Gabon recorded the largest gains in competitiveness

Africa’s Trade Is Shifting Increasingly Toward China
China’s share of Africa’s trade has expanded sharply since 2001, with imports from China now matching Europe’s share

Africa’s Export Growth Remains Commodity-Led, with Scale Concentrated in a Handful of Economies
Exports have grown steadily since 2015, but minerals, fuels and metals still dominate, while five countries account for half of the total