China Leads Key Nodes Across Global Shipbuilding, Ownership and Trade
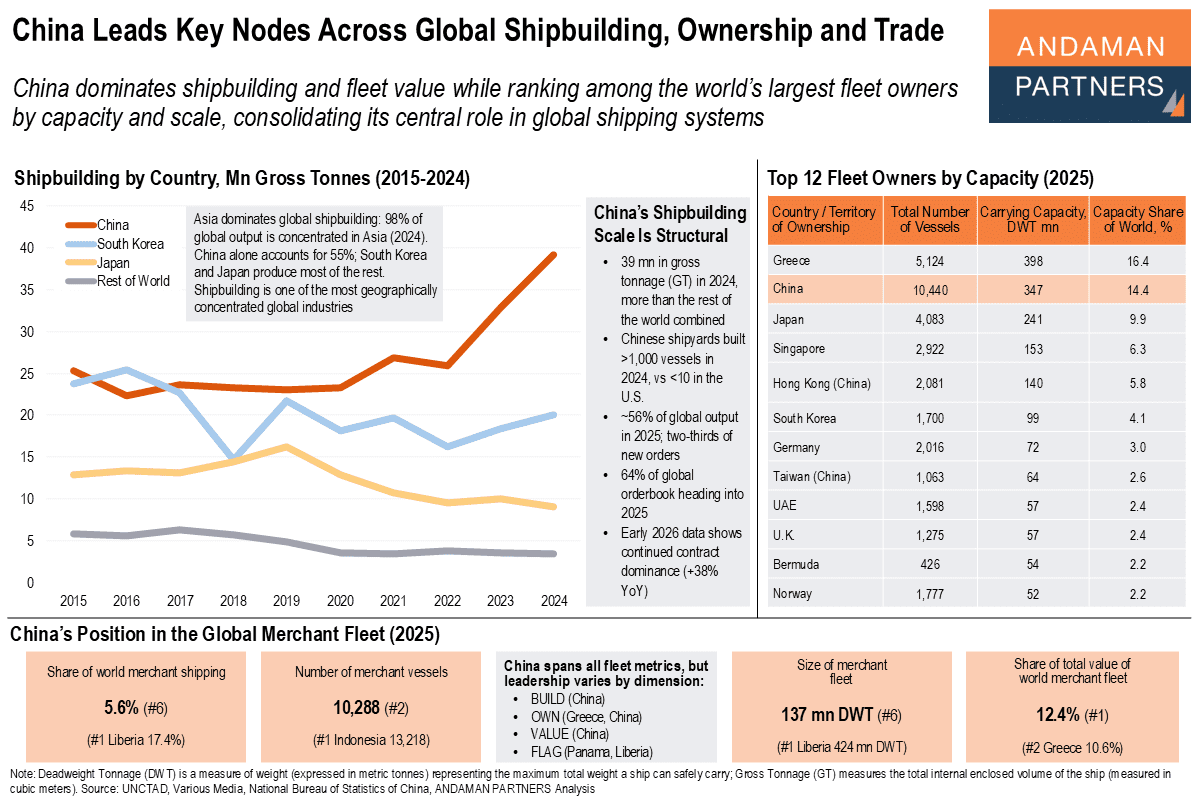
China dominates shipbuilding and fleet value while ranking among the world’s largest fleet owners by capacity and scale.
China dominates shipbuilding and fleet value while ranking among the world’s largest fleet owners by capacity and scale.
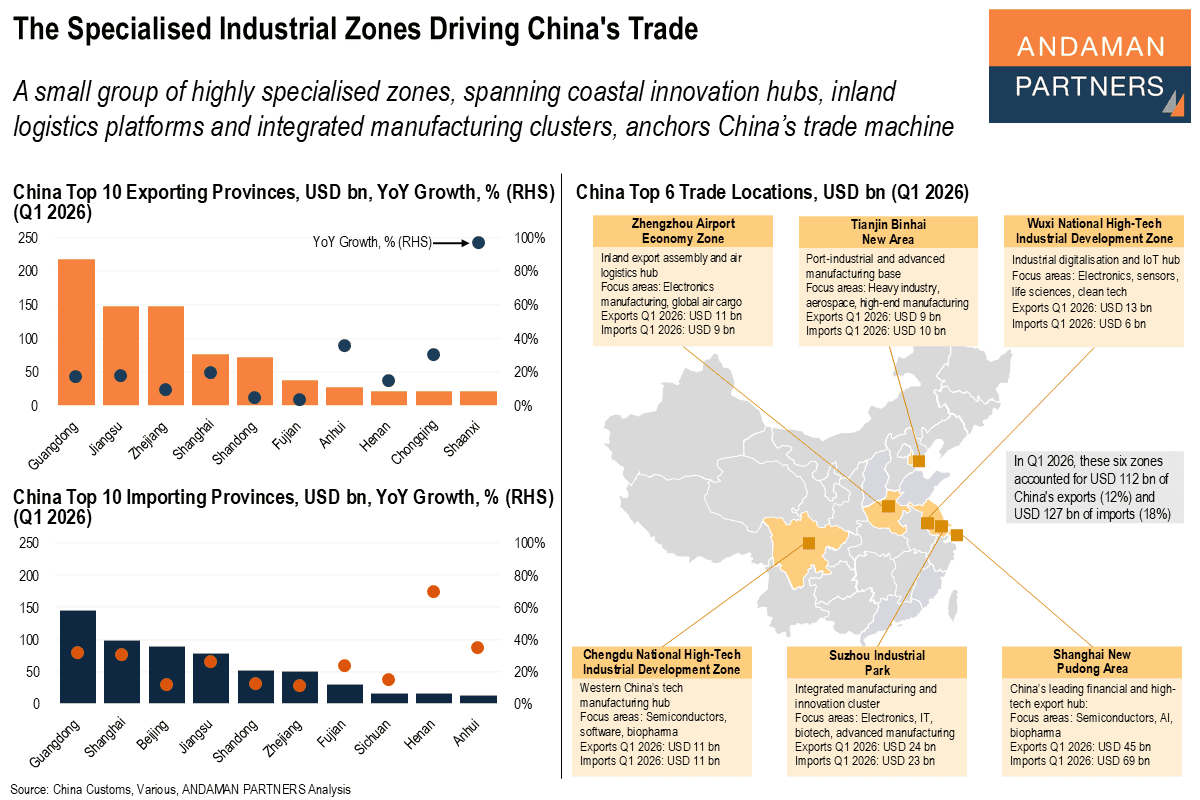
A small group of highly specialised zones anchors China’s trade machine.
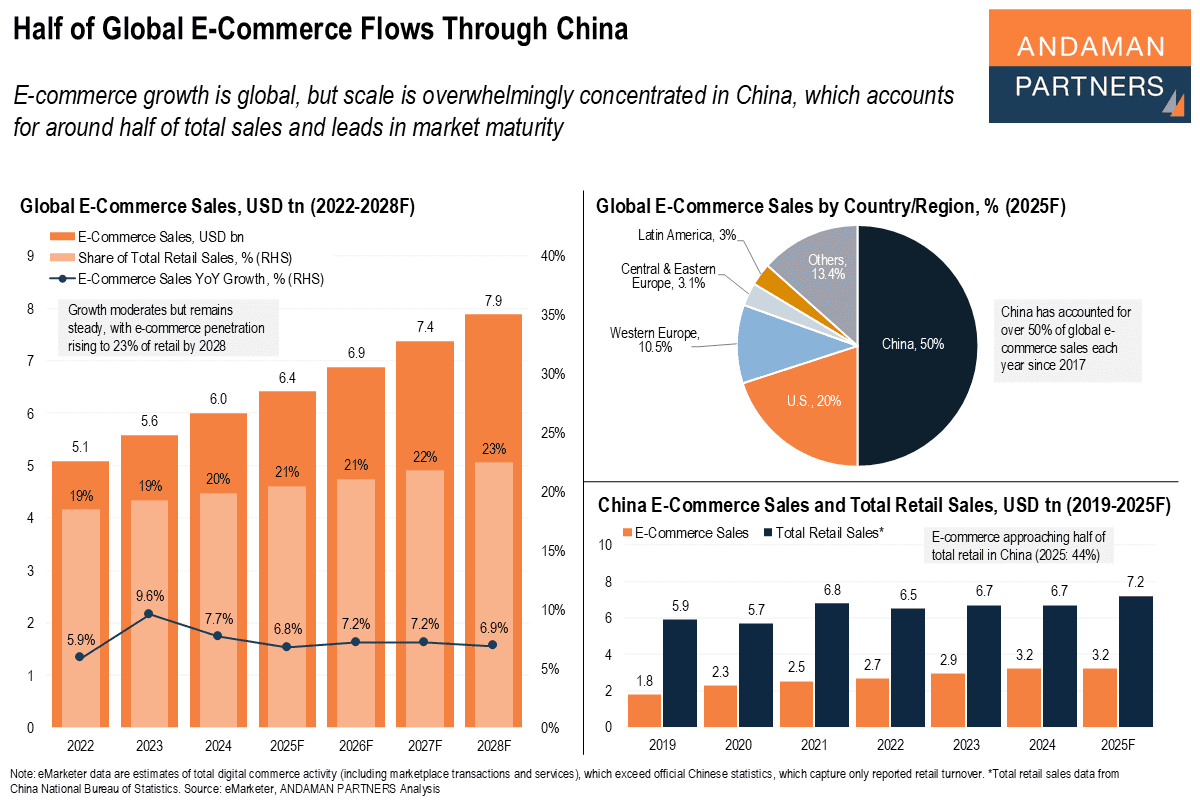
E-commerce growth is global, but scale is overwhelmingly concentrated in China.
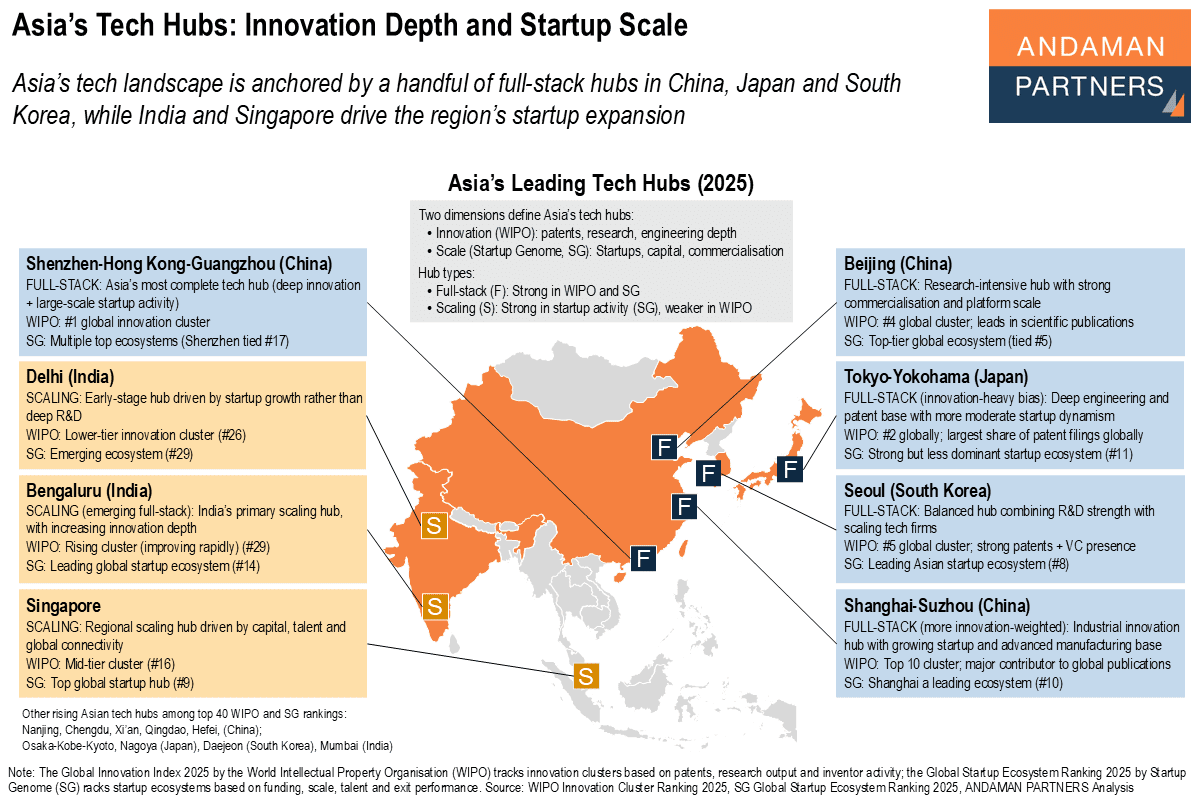
Asia’s tech landscape is anchored by a handful of full-stack hubs in China, Japan and South Korea, while India and Singapore drive startup expansion.
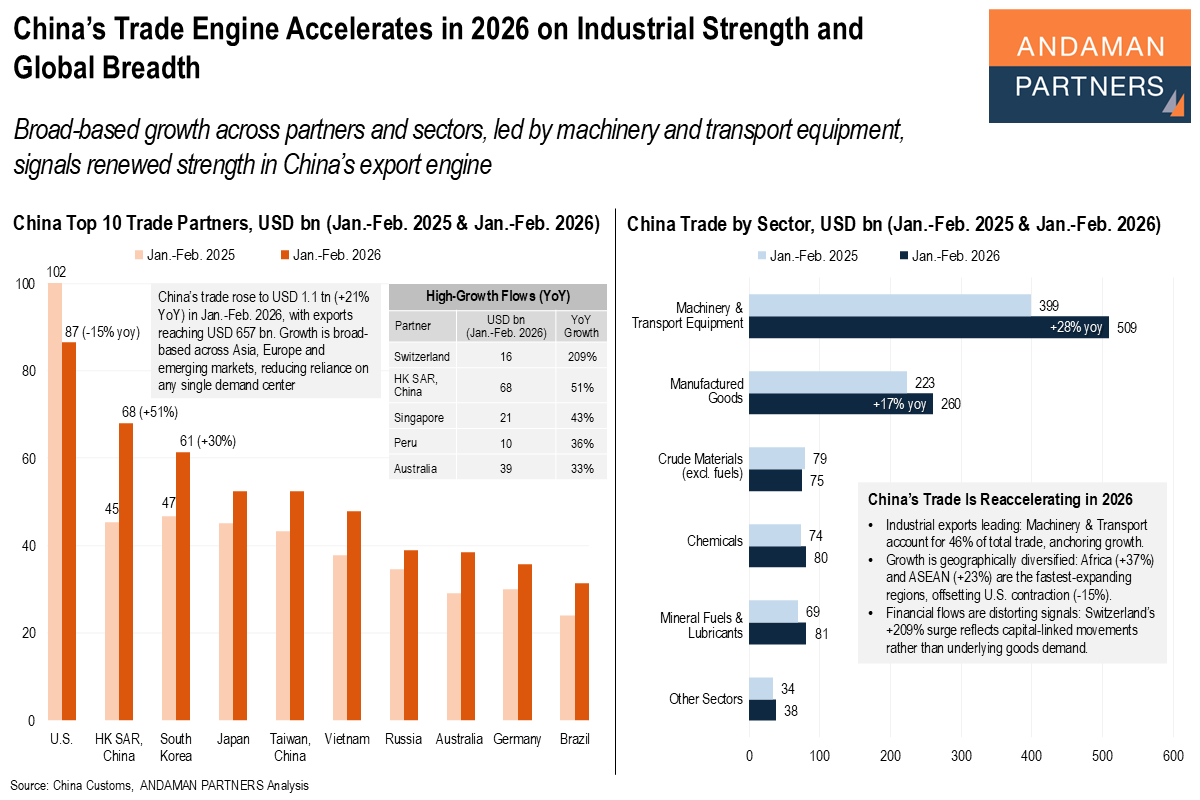
Broad-based growth across partners and sectors, led by machinery and transport equipment, signals renewed strength in China’s export engine.
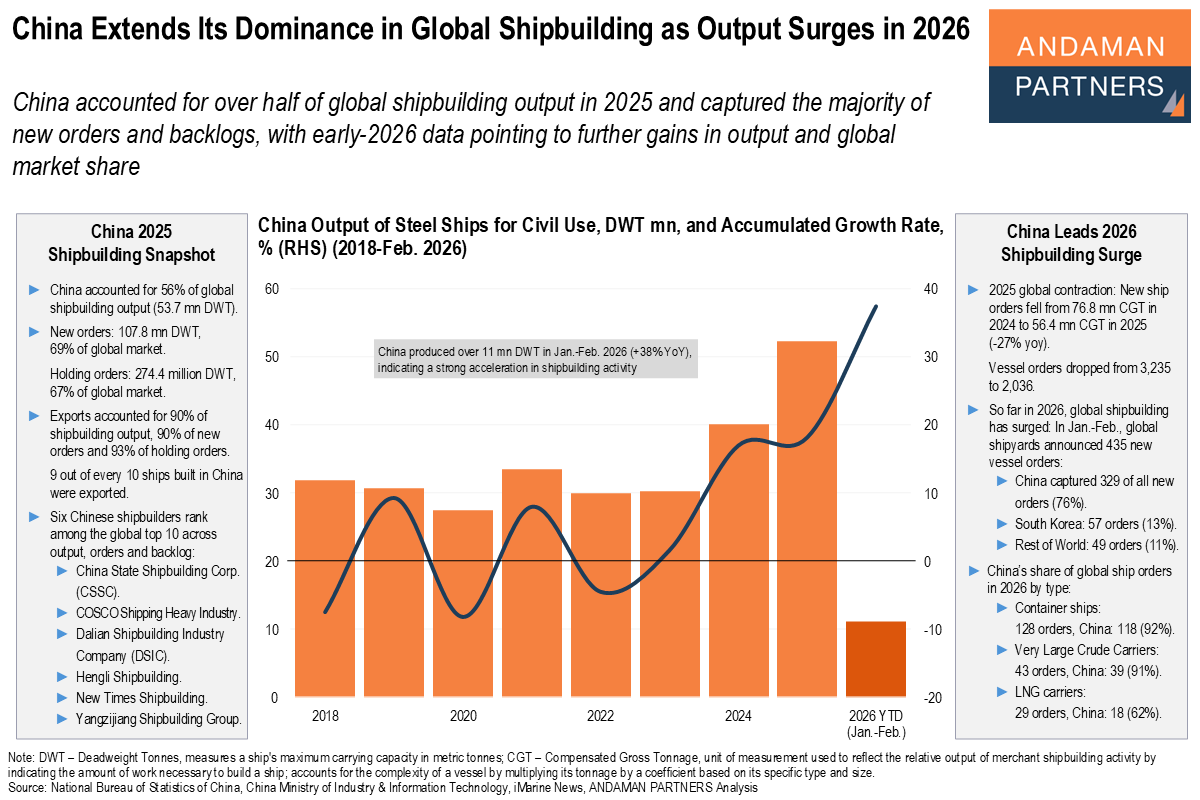
Even as global ship orders declined in 2025, early-2026 data shows a rapid rebound, with China securing the vast majority of new contracts.
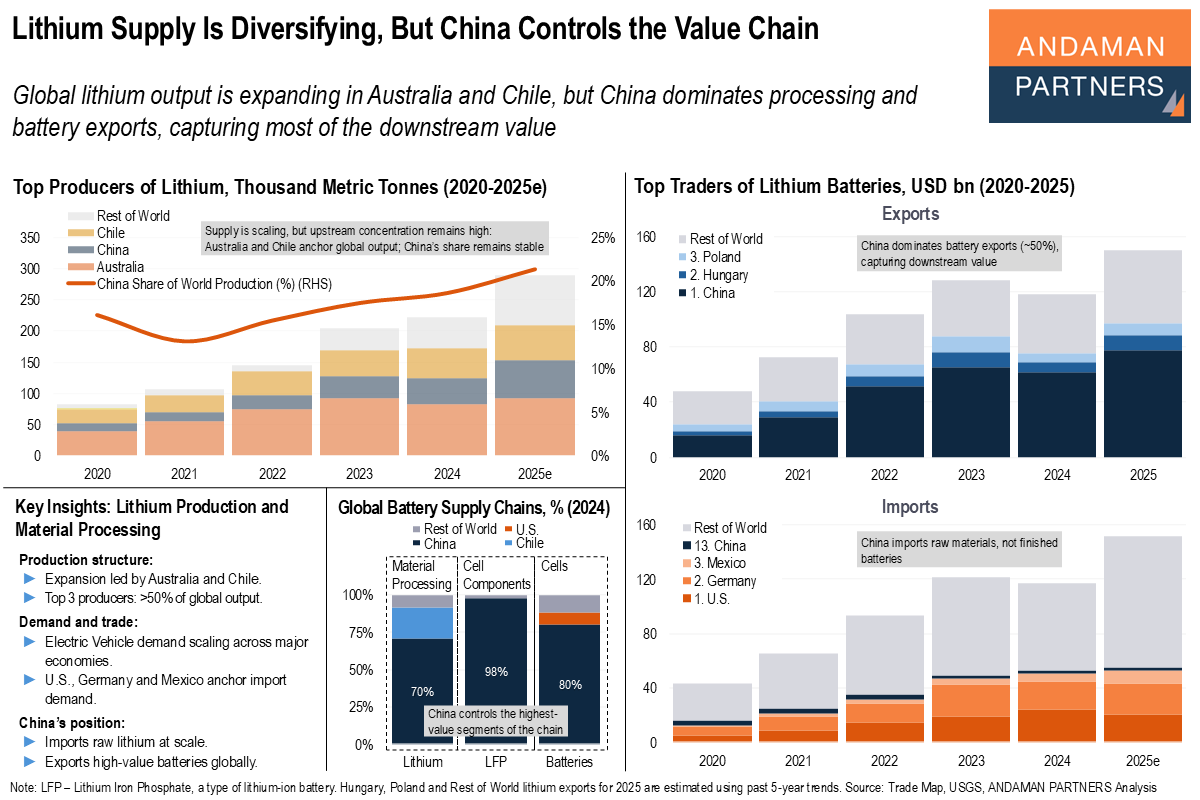
Global lithium output is expanding in Australia and Chile, but China dominates processing and battery exports, capturing most of the downstream value.
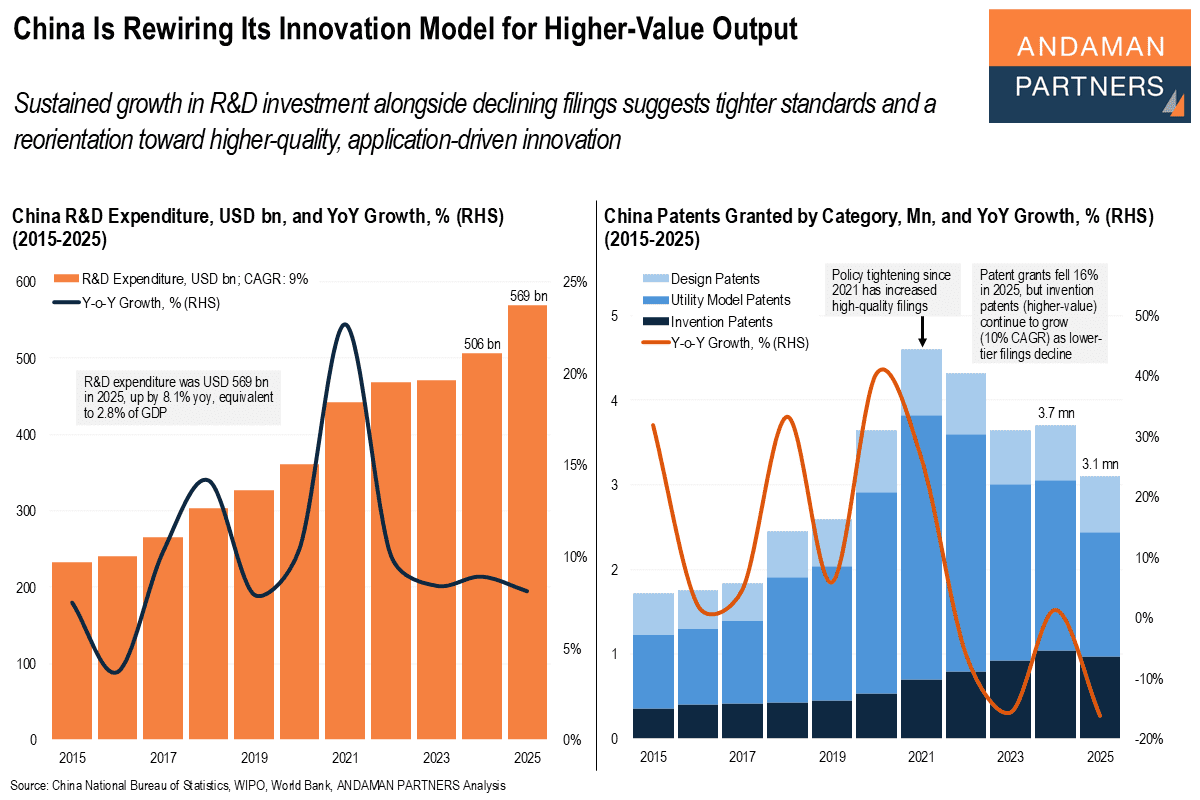
Sustained growth in R&D alongside declining filings suggests tighter standards and a reorientation toward higher-quality innovation.
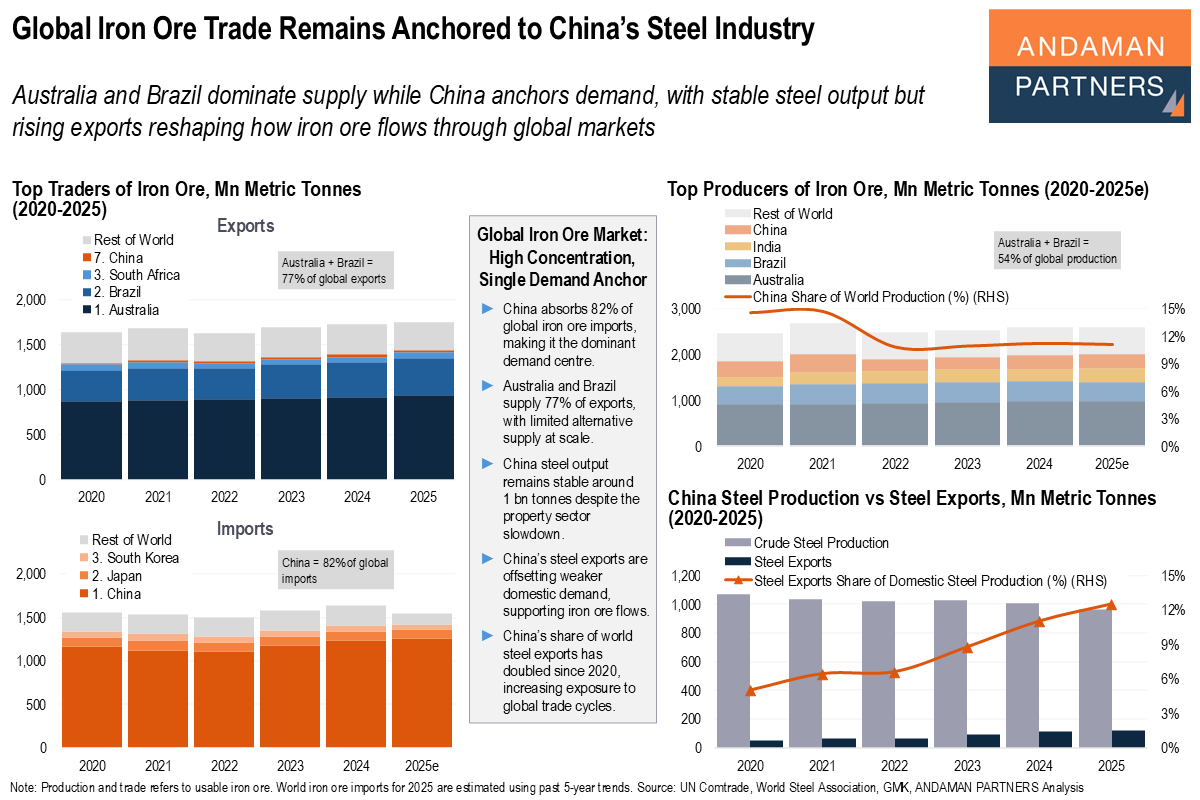
Australia and Brazil dominate supply while China anchors demand, with rising exports reshaping how iron ore flows through global markets.
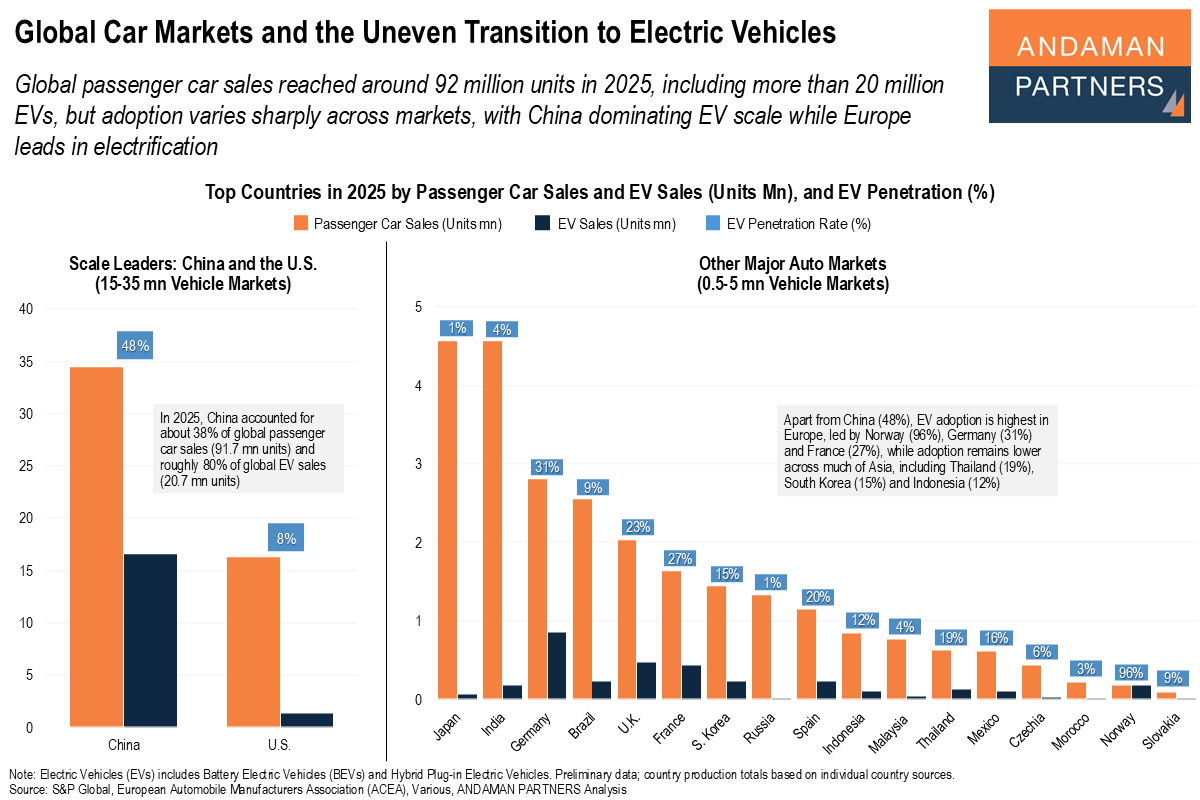
Global passenger car sales reached 92 million units in 2025, including more than 20 million EVs, but adoption varies widely across markets.