Key Players in the Global Fuels & Mining Products Trade
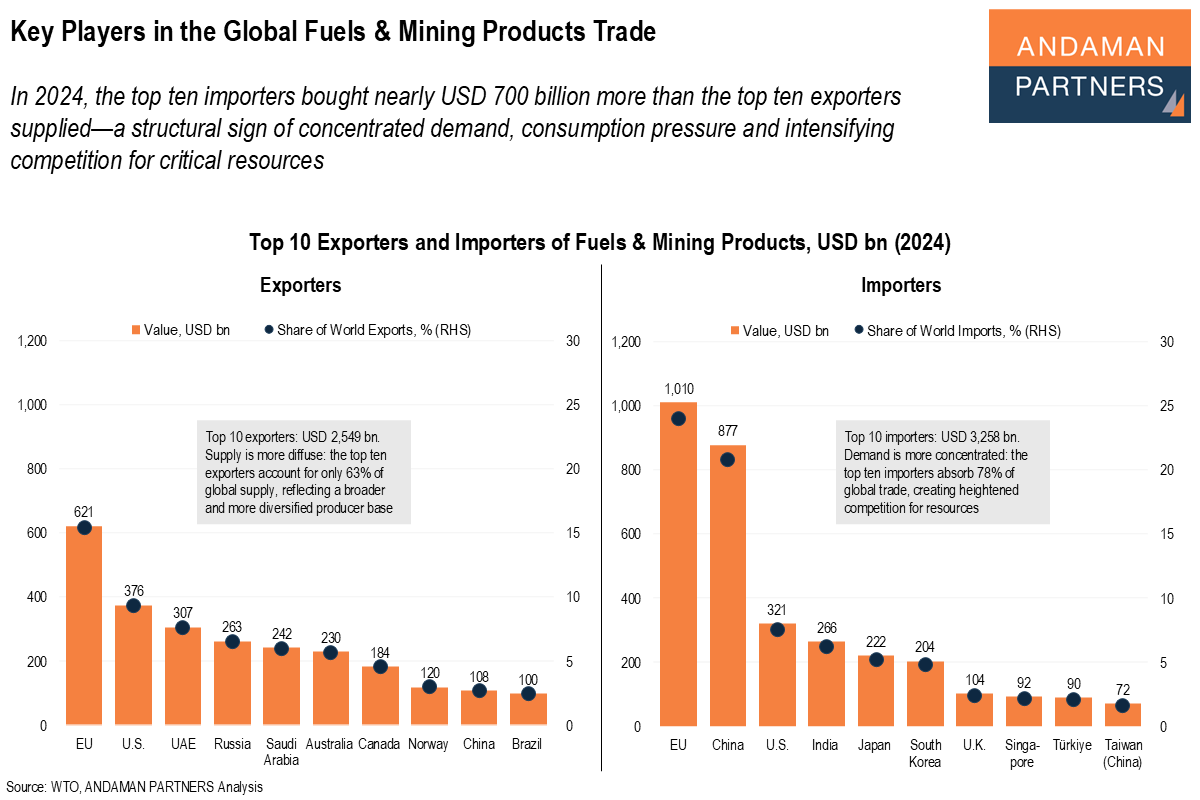
In 2024, the top ten importers bought nearly USD 700 billion more than the top ten exporters supplied.

In 2024, the top ten importers bought nearly USD 700 billion more than the top ten exporters supplied.
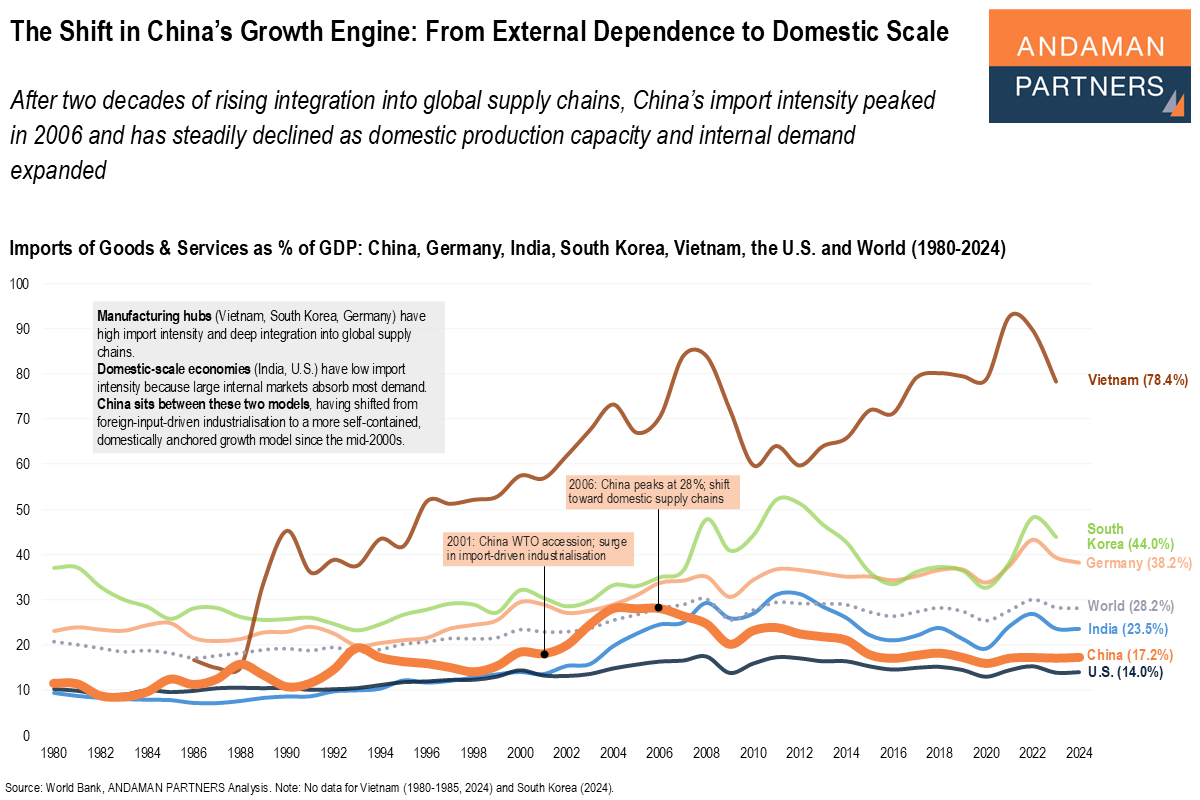
China’s import intensity peaked in 2006 and has steadily declined since then as domestic production capacity and internal demand expanded.
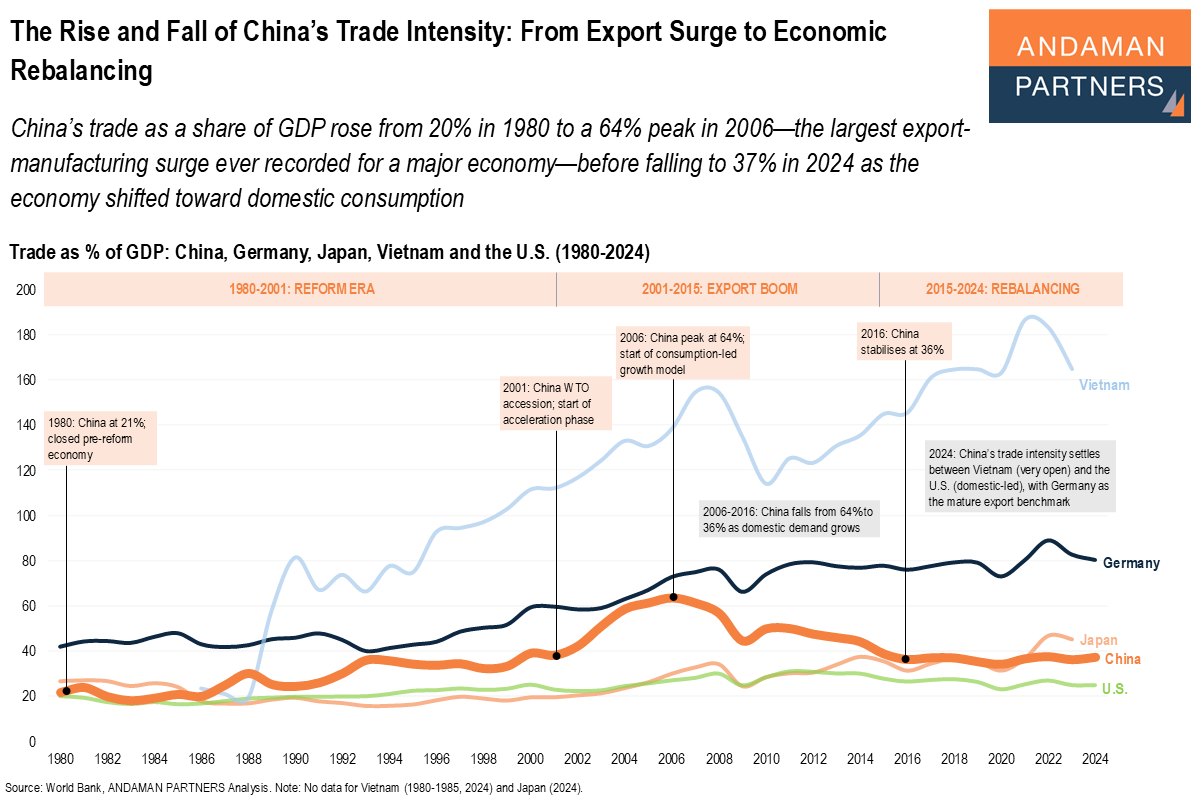
China’s trade as a share of GDP rose from 20% in 1980 to a peak of 64% in 2006 before falling to 37% in 2024 as the economy shifted toward domestic consumption.
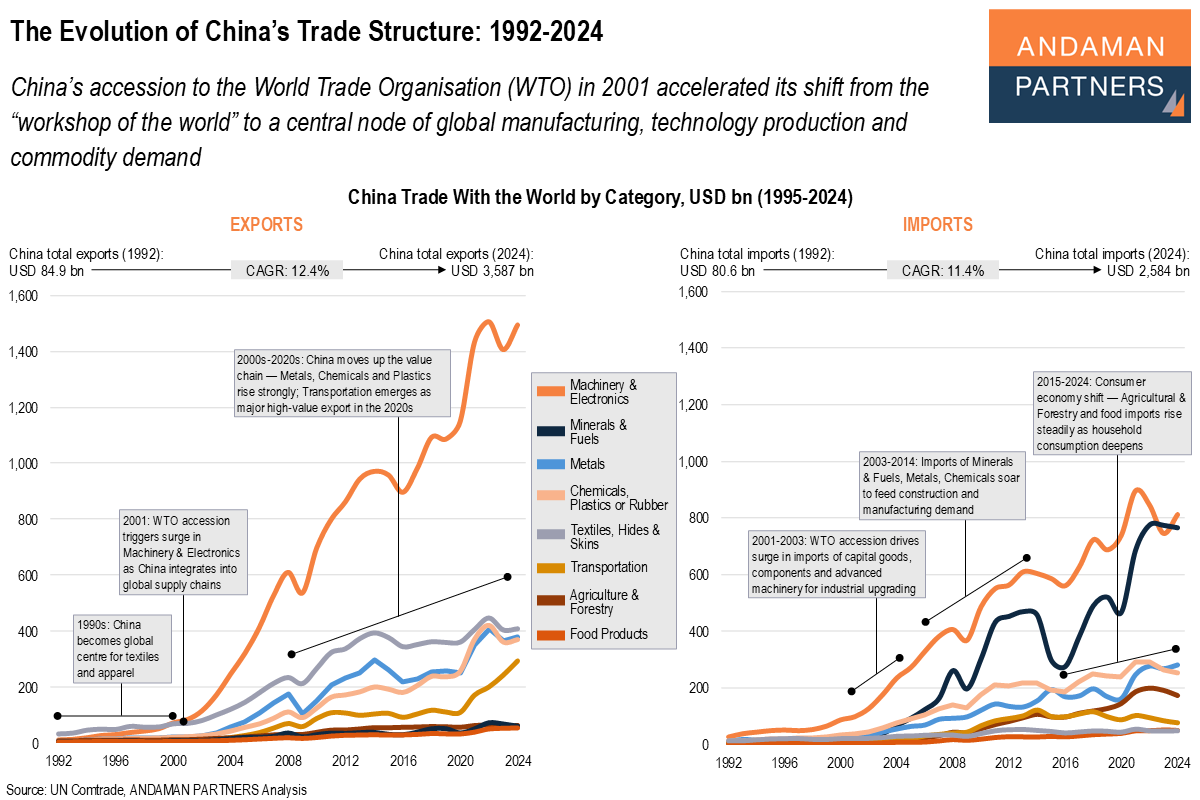
China’s accession to the WTO accelerated its shift from the “workshop of the world” to a central node of manufacturing, production and demand.
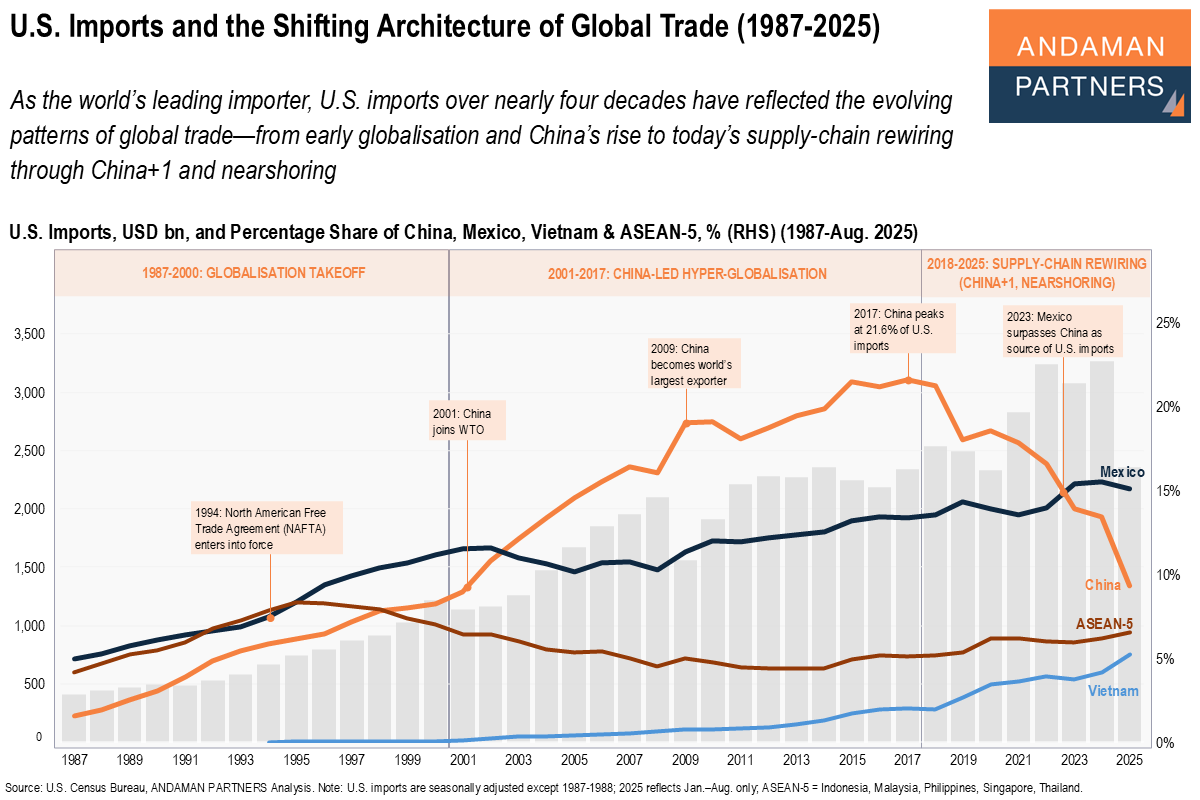
As the world’s leading importer, U.S. imports over nearly four decades have reflected the evolving patterns of global trade.
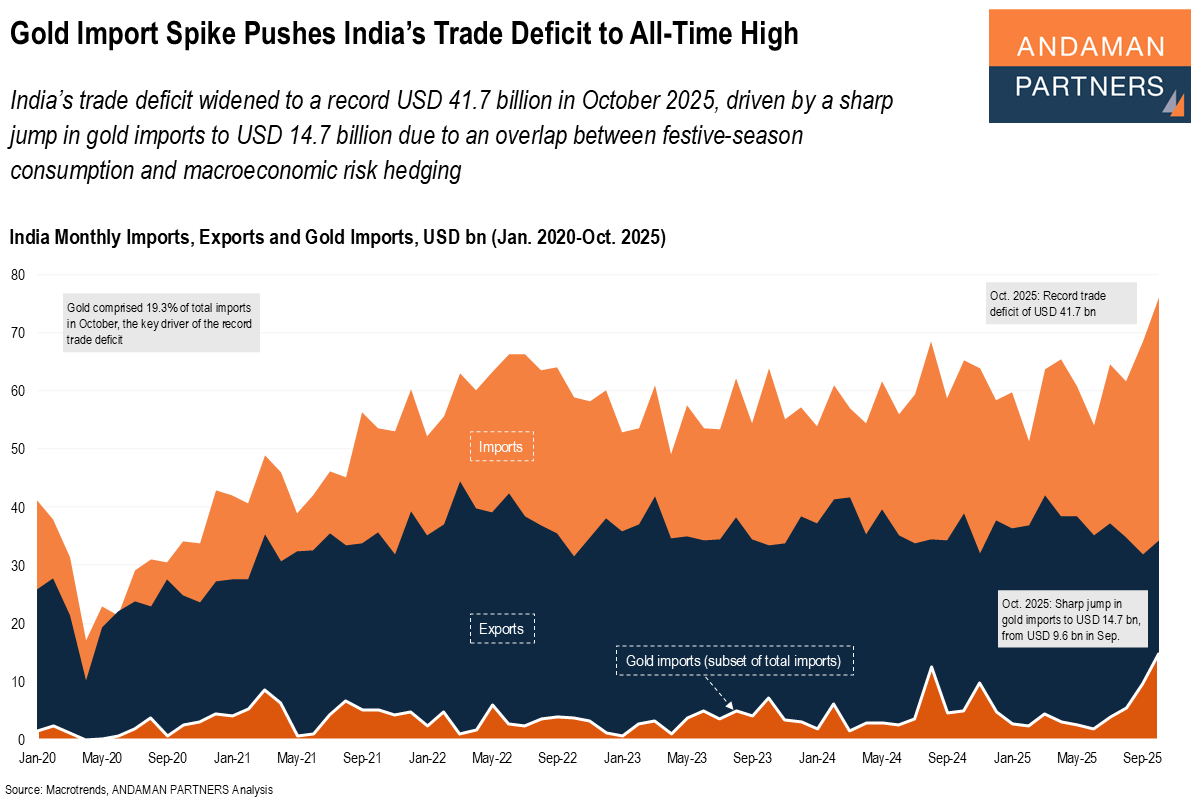
India’s trade deficit widened to a record USD 41.7 billion in October 2025, driven by a sharp jump in gold imports to USD 14.7 billion.
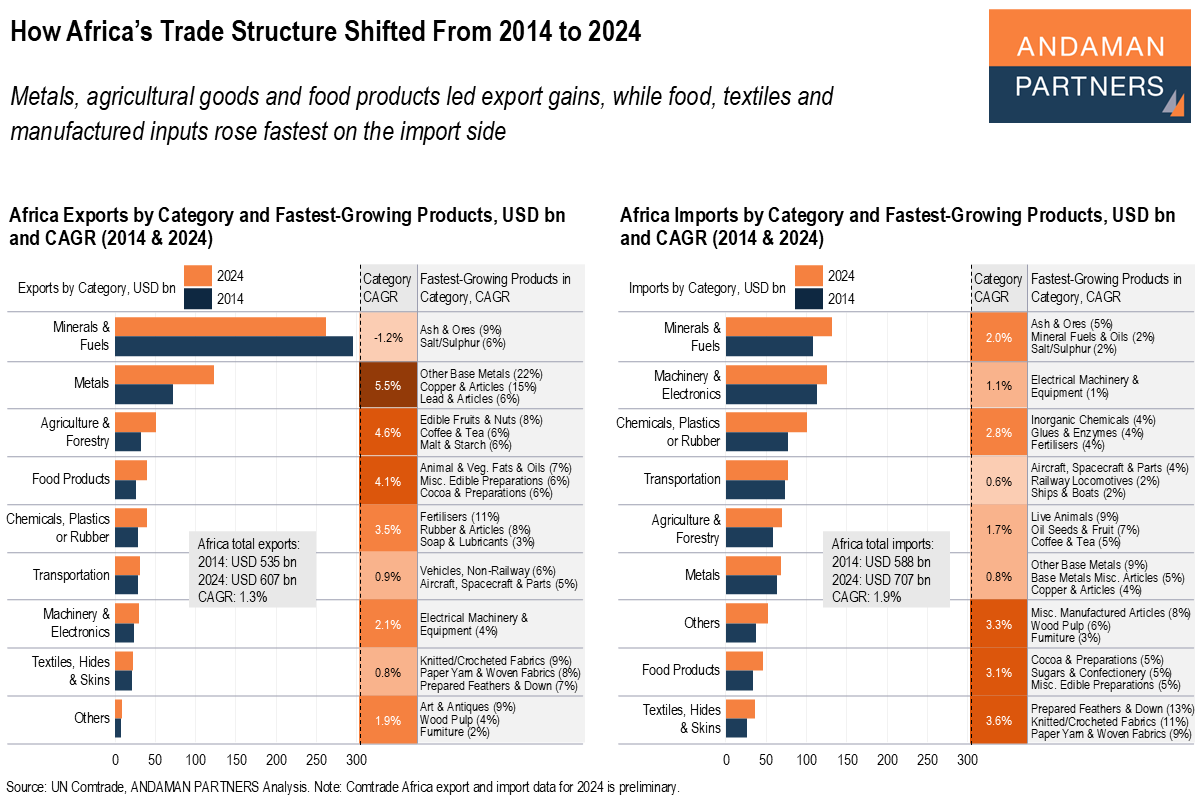
Metals, agricultural goods and food products led export gains, while food, textiles and manufactured inputs rose fastest on the import side.
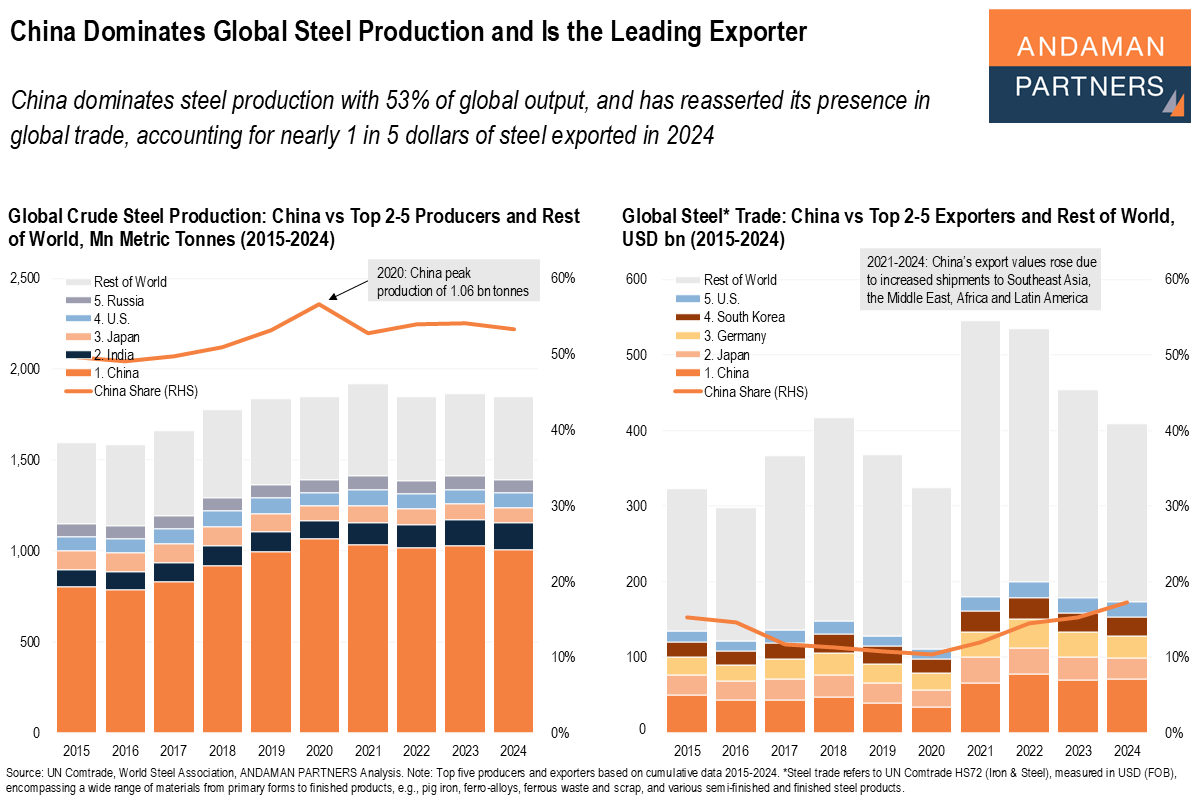
China dominates steel production, accounting for 53% of global output and nearly 1 in 5 dollars of steel exports in 2024.
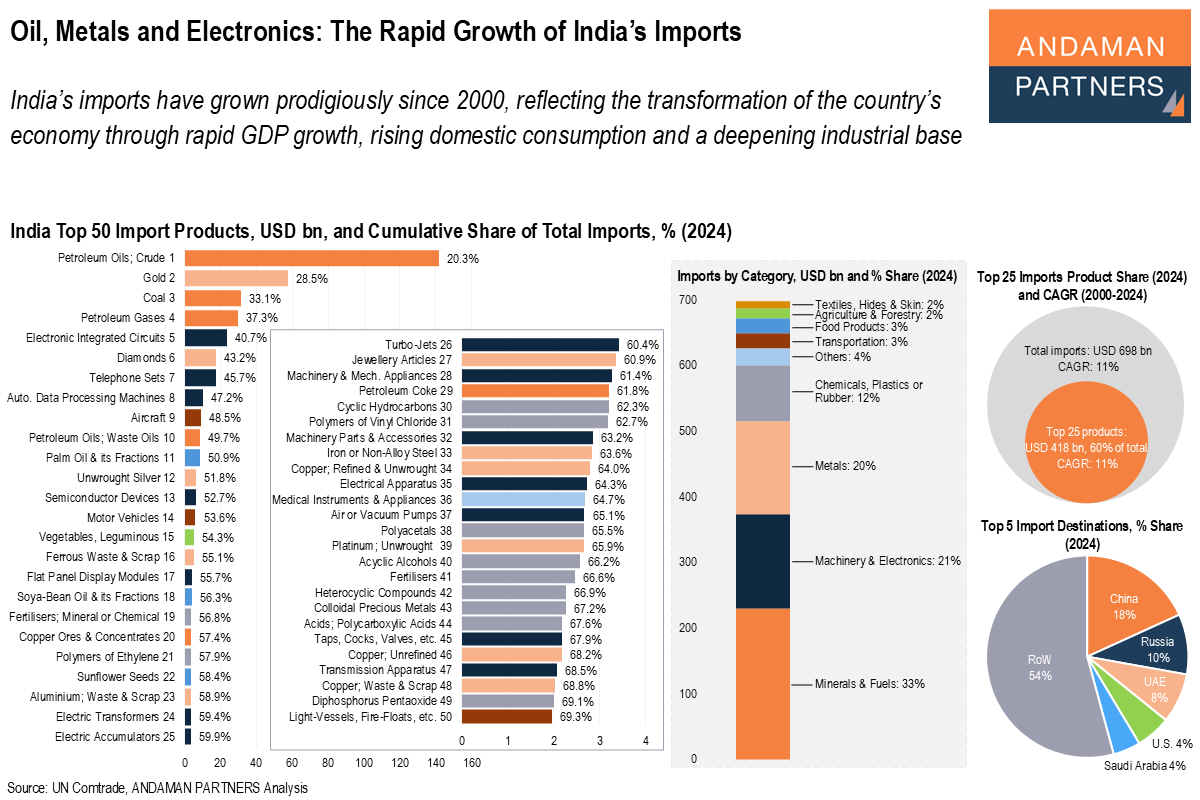
India’s imports have grown prodigiously since 2000, reflecting the transformation of the country’s economy.
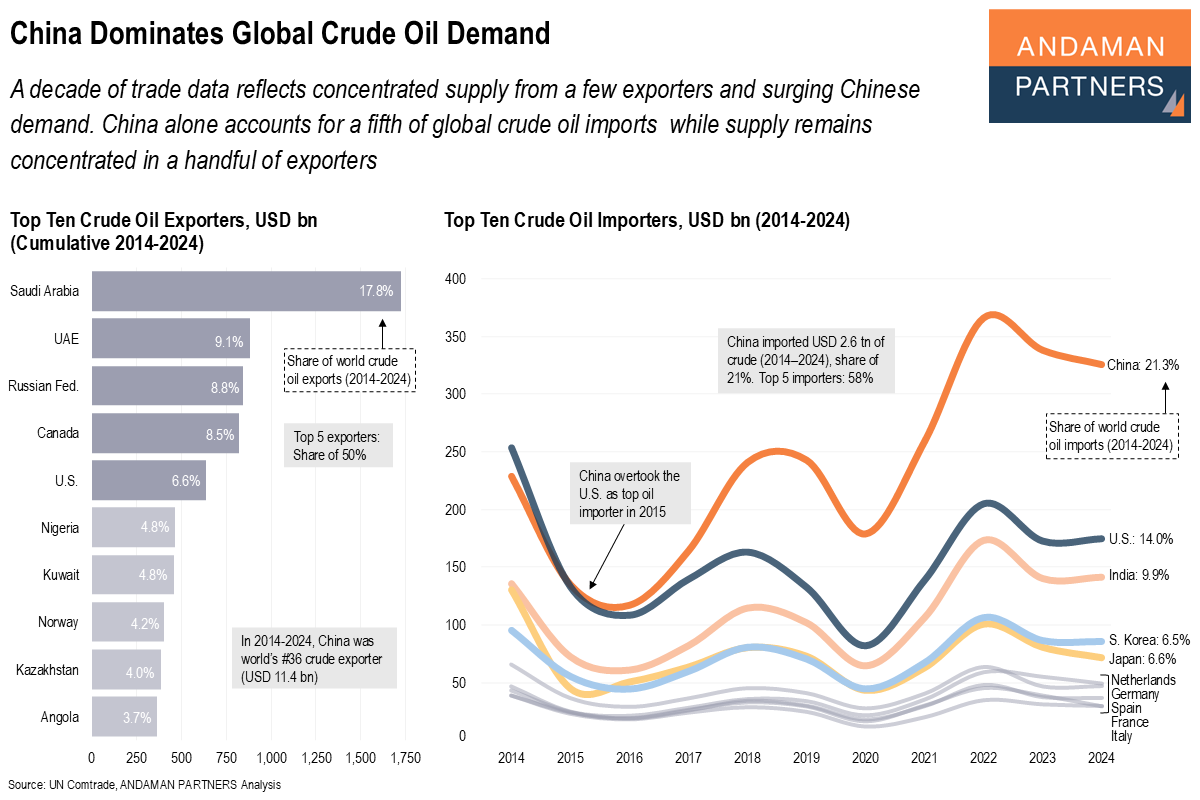
China alone accounts for a fifth of global crude oil imports while supply remains concentrated in a handful of exporters.