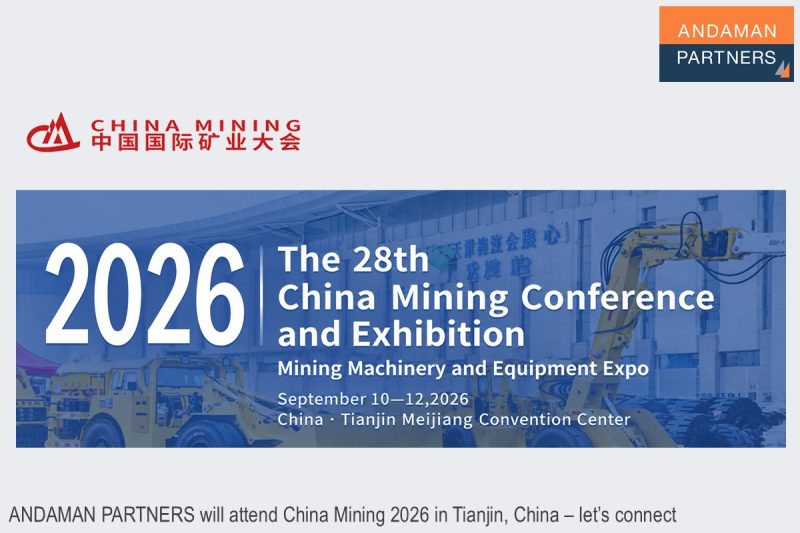
ANDAMAN PARTNERS to Attend China Mining 2026 in Tianjin, China
ANDAMAN PARTNERS will attend the China Mining Conference and Exhibition in Tianjin, China, on 10-12 September 2026

ANDAMAN PARTNERS at the Singapore Institute of Directors Annual Conference 2026
ANDAMAN PARTNERS at the Singapore Institute of Directors Conference 2026 in Singapore on 28 August 2026
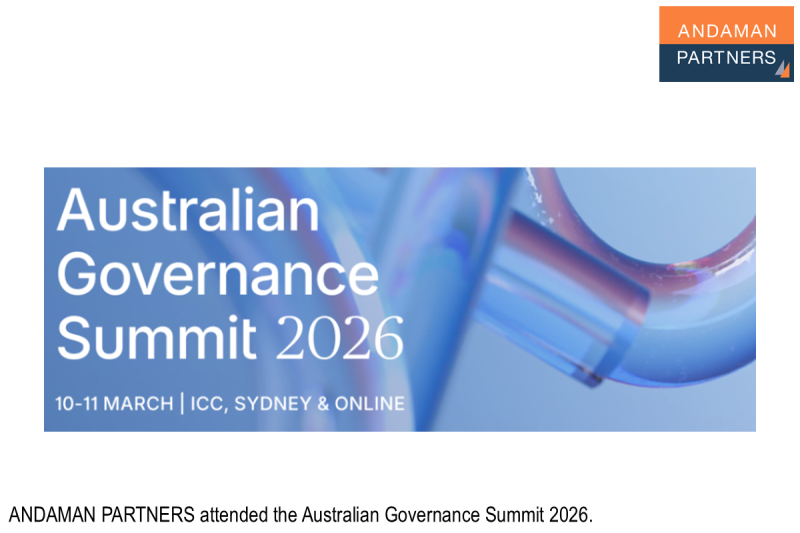
ANDAMAN PARTNERS Attended the Australia Governance Summit 2026 in Sydney
ANDAMAN PARTNERS Co-Founder Kobus van der Wath attended the Australia Governance Summit (AGS26) in Sydney, Australia.
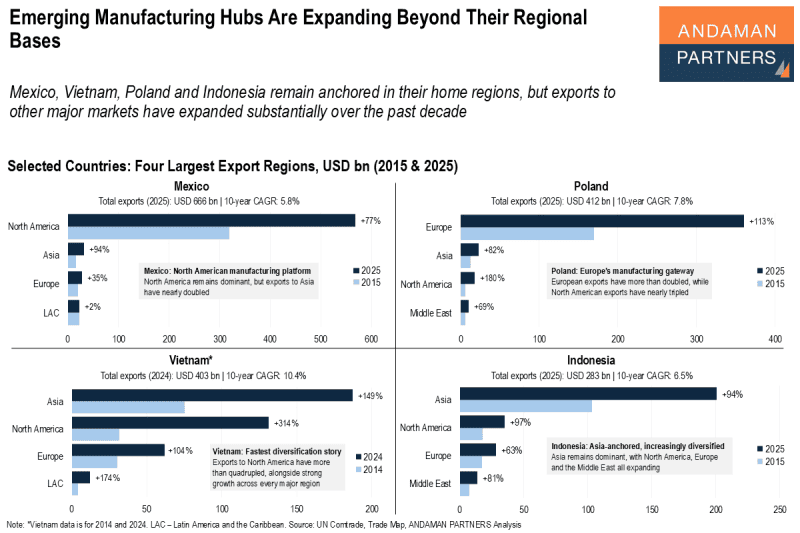
Emerging Manufacturing Hubs Are Expanding Beyond Their Regional Bases
Mexico, Vietnam, Poland and Indonesia remain anchored in their home regions, but exports to other major markets have expanded substantially
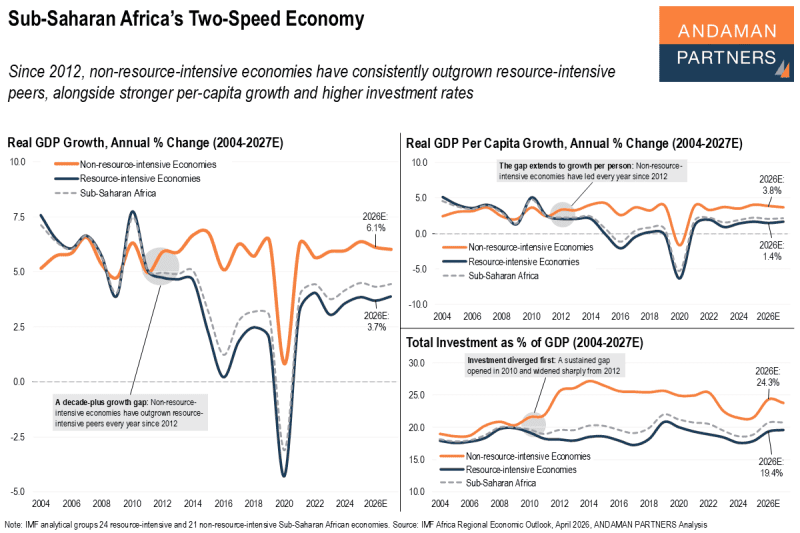
Sub-Saharan Africa’s Two-Speed Economy
Since 2012, non-resource-intensive economies have consistently outgrown resource-intensive peers
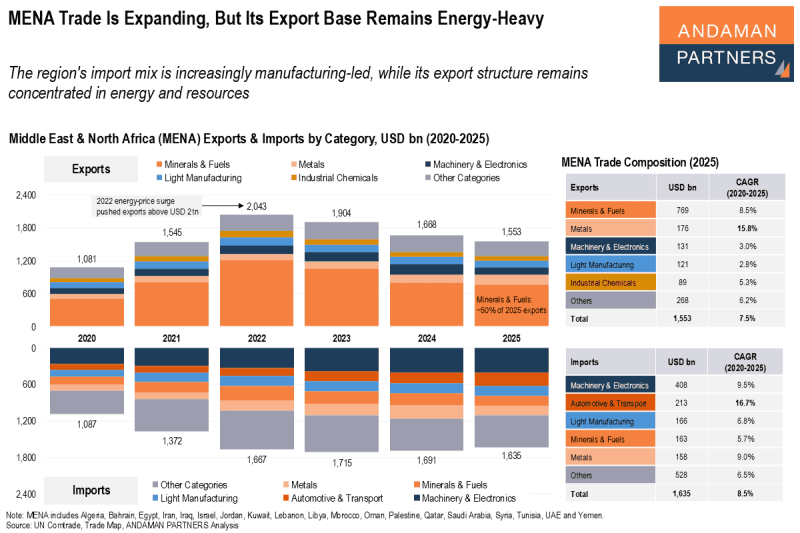
MENA Trade Is Expanding, But Its Export Base Remains Energy-Heavy
The region’s import mix is increasingly manufacturing-led, while its export structure remains concentrated in energy and resources.