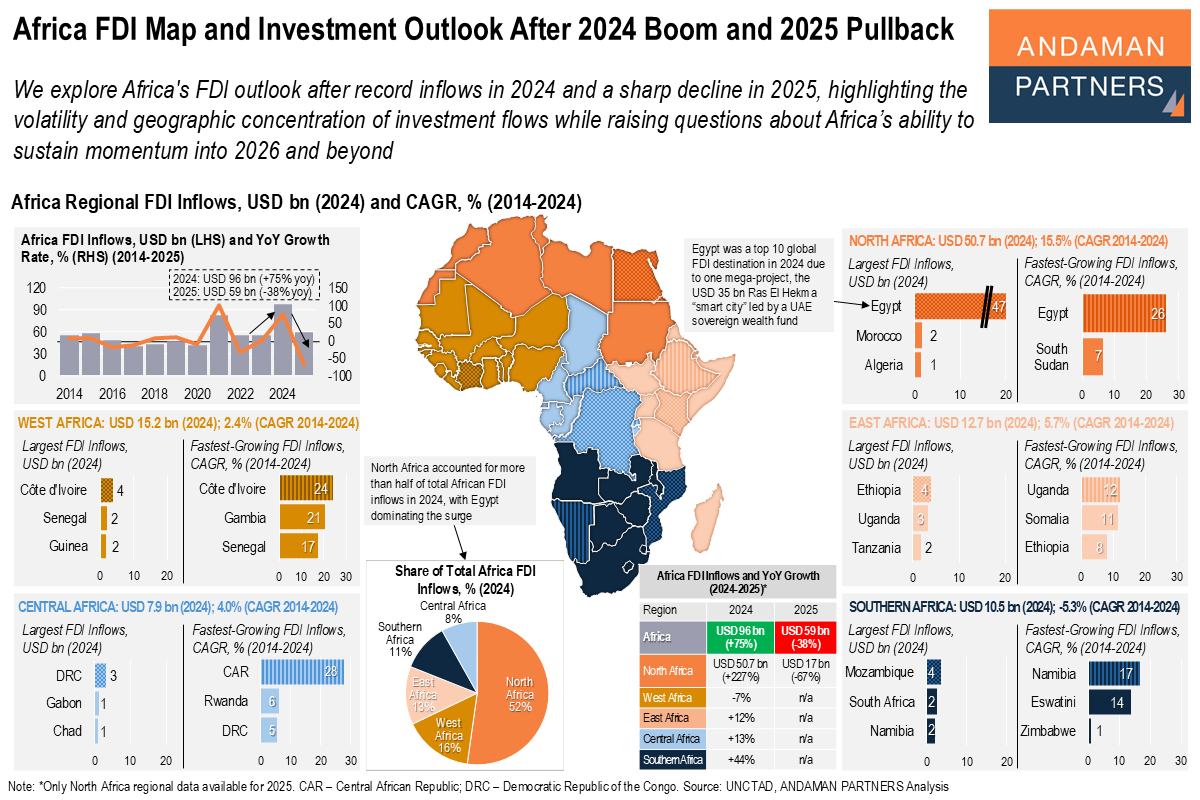
Africa’s FDI outlook remains uncertain after a sharp reversal in investment flows over the past two years. Following a record surge in 2024, inflows fell markedly in 2025, underscoring the volatility and concentration that continue to characterise foreign investment across the continent. The recent cycle illustrates how Africa’s headline FDI performance can be heavily influenced by a small number of large projects and a limited group of leading destinations.
Amid heightened global economic and geopolitical uncertainty, the trajectory for 2026-2027 will depend on whether investment activity broadens geographically and sectorally or remains dependent on episodic mega-deals that generate large year-to-year swings.
Africa’s recent FDI trajectory has been defined by extreme volatility. According to UNCTAD, inflows surged to a record USD 96 billion in 2024 (+75% yoy), then fell sharply to USD 59 billion in 2025 (-38%). This swing reflects the continent’s continued dependence on a small number of large-scale transactions. North Africa alone accounted for 52% of total African FDI inflows in 2024, with Egypt driving the majority of it. In effect, 2024’s record high was not a broad-based continental boom but a highly concentrated spike, which helps explain the rapid pullback seen in 2025.
North Africa received USD 50.7 billion in inflows in 2024 (+227% yoy), supported by a strong 15.6% CAGR over 2014-2024. Egypt dominated with USD 47 billion, while Morocco (USD 2 billion) and Algeria (USD 1 billion) received much smaller inflows. Egypt was also the fastest-growing market in the region, with a 26% CAGR (2014-2024), reflecting the impact of a landmark UAE-backed Ras El Hekma “smart city” development project announced in 2024.
Valued at around USD 35 billion, this single investment helped propel Egypt into the world’s top 10 FDI destinations in 2024 and accounts for much of North Africa’s outsized share of continental inflows. This example illustrates how Africa’s headline FDI totals can be heavily influenced by a small number of mega-deals, contributing to large year-to-year fluctuations.
In 2025, North Africa inflows declined by 67% yoy to USD 17 billion, reversing much of the previous year’s surge as the exceptional investment activity that had driven the 2024 spike, particularly large-scale projects in Egypt, did not repeat at the same scale.
West Africa recorded USD 15.2 billion in inflows in 2024 (-7% yoy), with a modest long-term CAGR of 2.4%. Côte d’Ivoire led regional inflows with USD 4 billion, followed by Senegal and Guinea, each at around USD 2 billion. Côte d’Ivoire also posted the strongest long-term growth (24% CAGR), alongside Gambia (21%) and Senegal (17%).
East Africa attracted USD 12.7 billion in inflows in 2024 (+12% yoy), supported by a stronger 5.7% CAGR over the past decade. Ethiopia led at USD 4 billion, followed by Uganda (USD 3 billion) and Tanzania (USD 2 billion). Uganda was the region’s fastest-growing destination (12% CAGR), alongside Somalia (11%) and Ethiopia (9%).
In Central Africa, inflows reached USD 7.9 billion (+13% yoy) and grew at a 4.0% CAGR from 2014 to 2024. The Democratic Republic of the Congo (DRC) led with USD 3 billion, followed by Gabon and Chad, each at around USD 1 billion. The Central African Republic (CAR) recorded the strongest long-term growth (28% CAGR), ahead of Rwanda (6%) and the DRC (5%).
Finally, Southern Africa attracted USD 10.5 billion in inflows (+44% yoy), although the region remains structurally weaker with a negative long-term trend (-5.3% CAGR). Mozambique led with USD 4 billion, while South Africa and Namibia each attracted around USD 2 billion. Namibia recorded the fastest growth (17% CAGR), followed by Eswatini (14%).