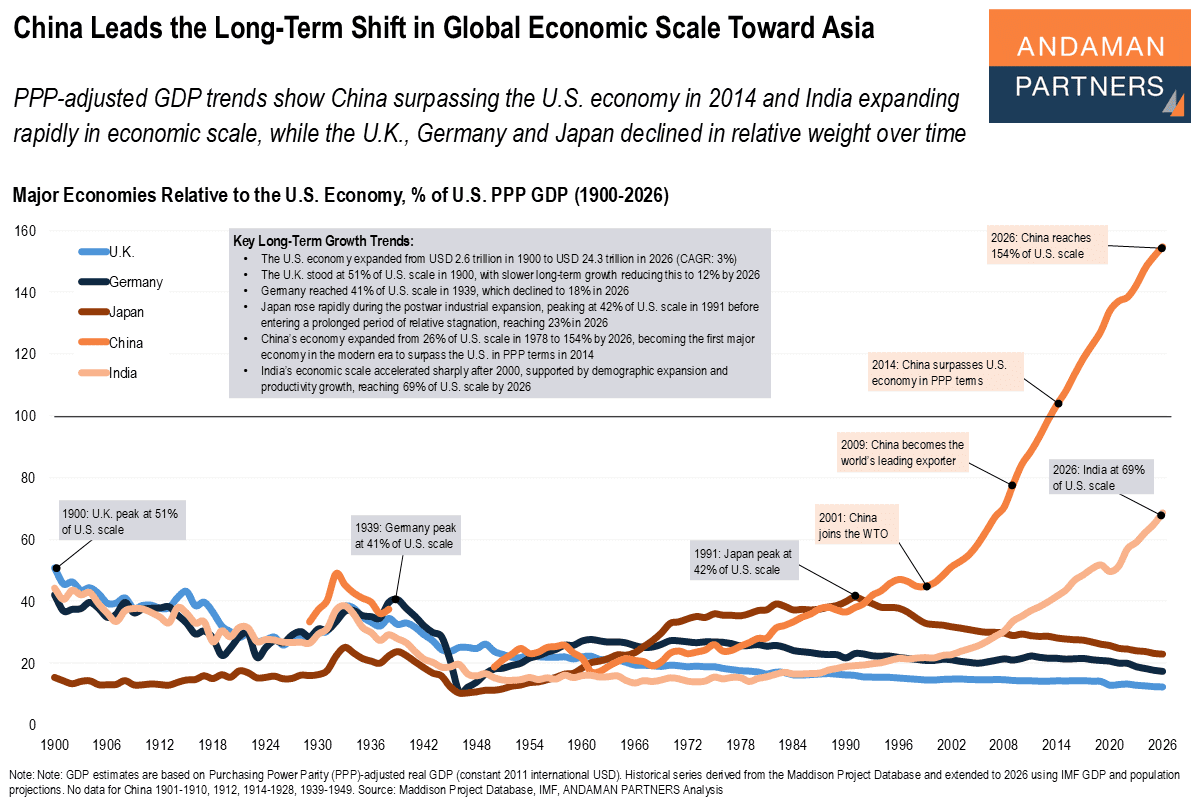
China Leads the Long-Term Shift in Global Economic Scale Toward Asia
PPP-adjusted GDP trends show China surpassing the U.S. economy in 2014 and India expanding rapidly in economic scale.
PPP-adjusted GDP trends show China surpassing the U.S. economy in 2014 and India expanding rapidly in economic scale.
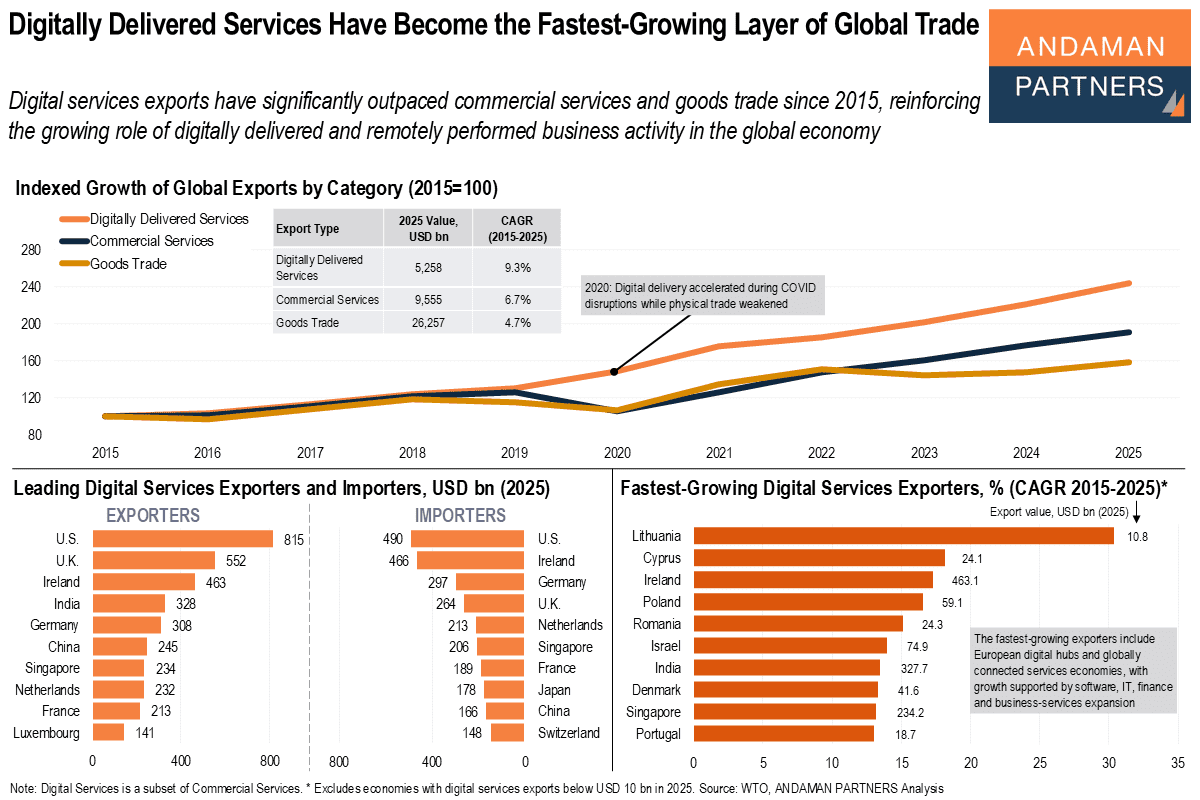
Digital services exports have significantly outpaced commercial services and goods trade since 2015.
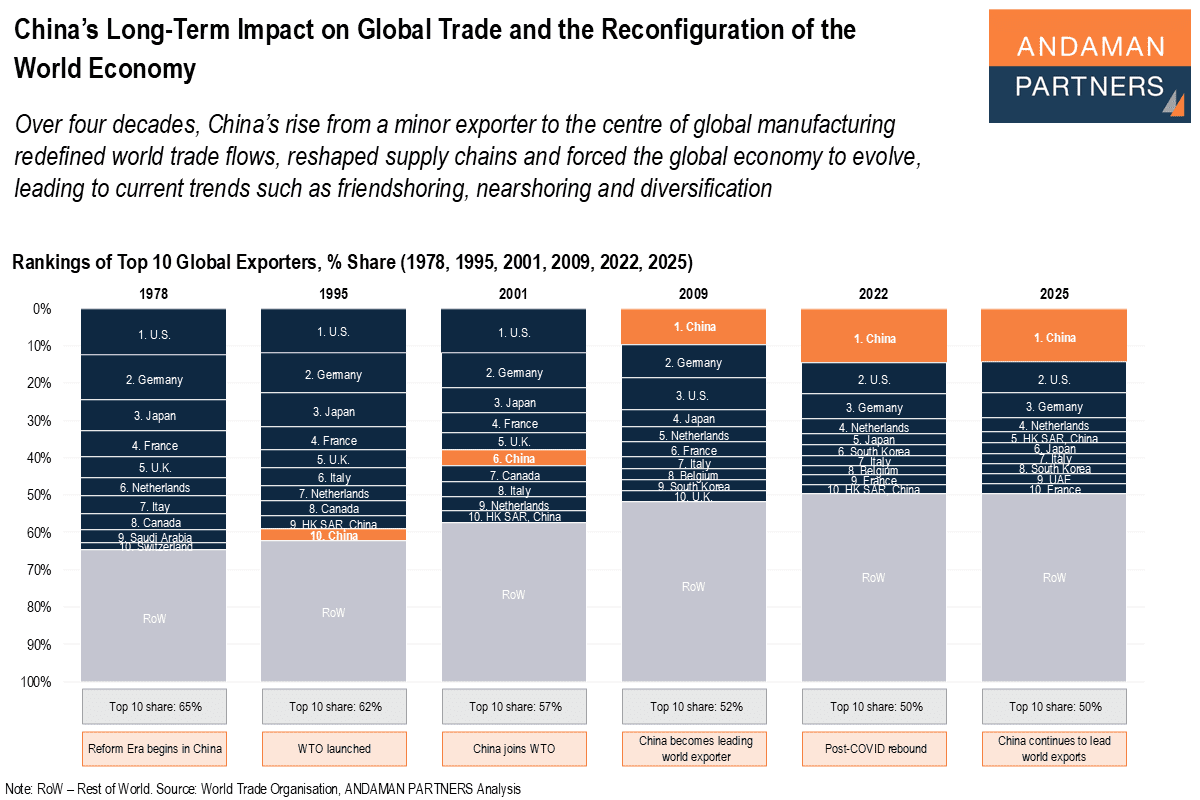
China’s rise from a minor exporter to the centre of global manufacturing redefined trade flows, reshaped supply chains and forced the global economy to evolve.
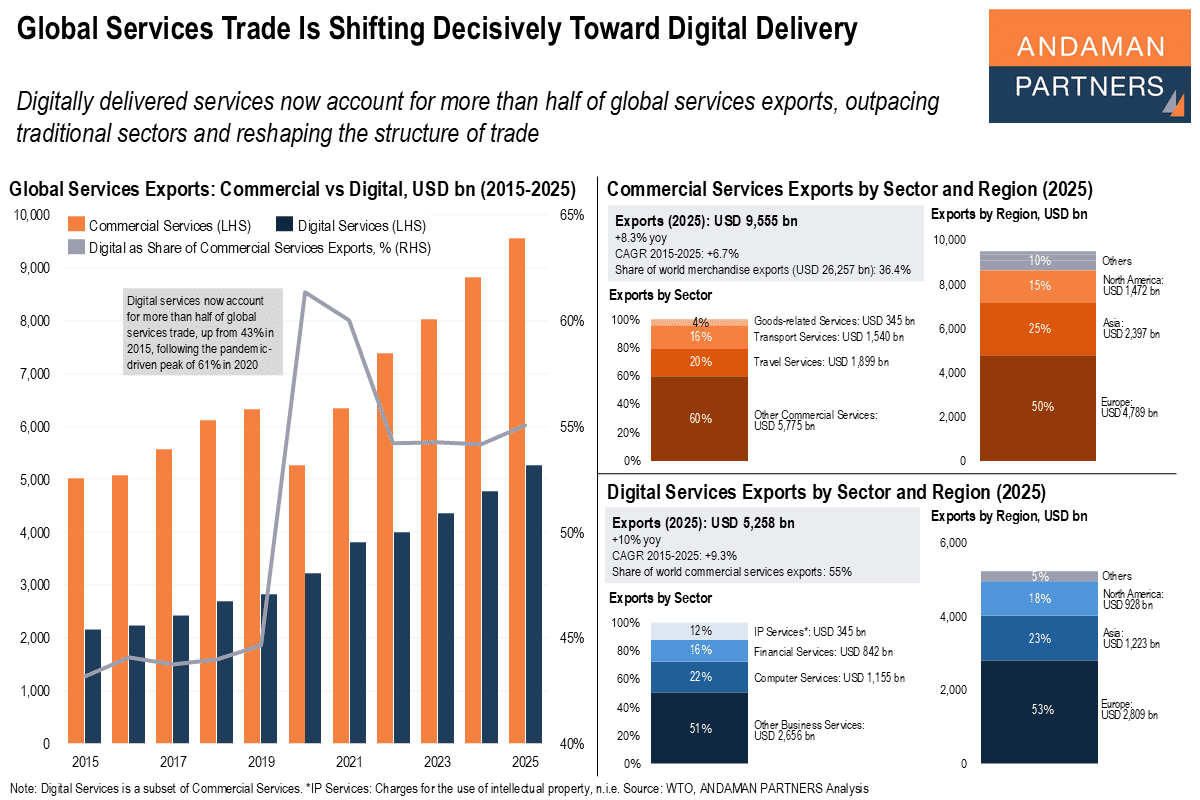
Digitally delivered services now account for more than half of global services exports, outpacing traditional sectors and reshaping the structure of trade.
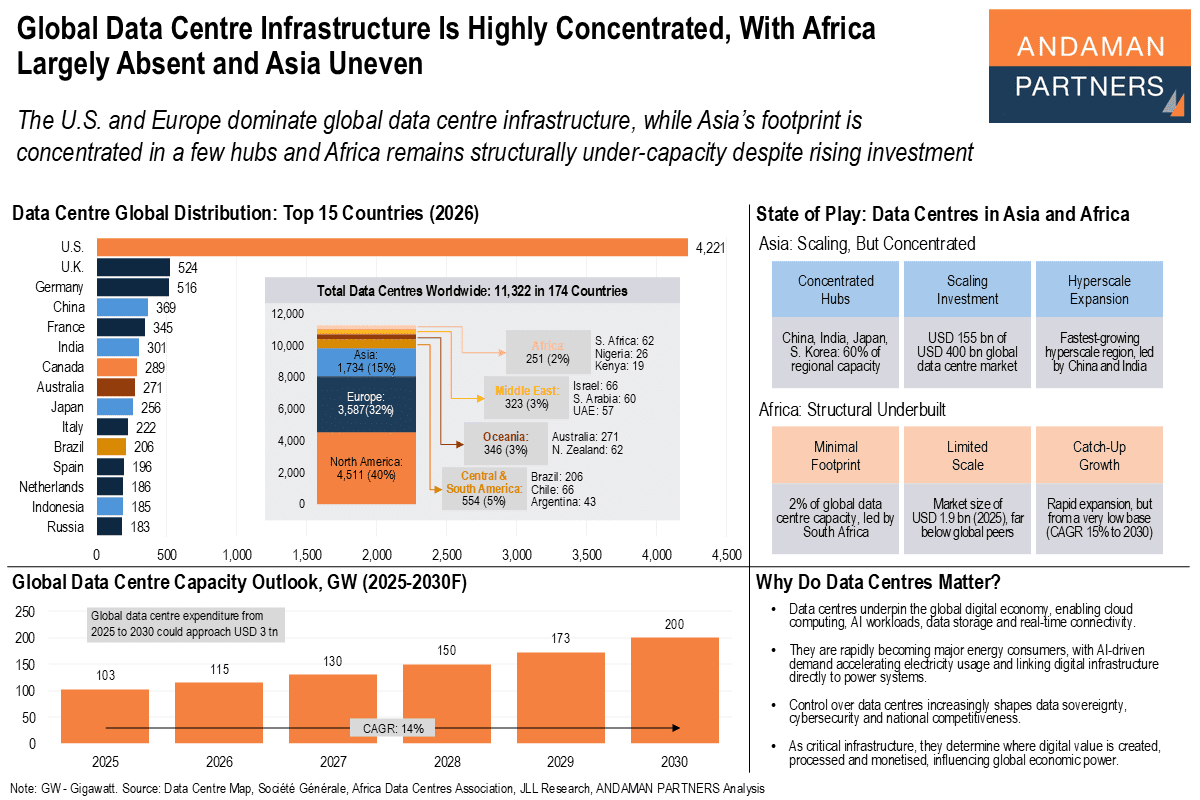
The U.S. and Europe dominate global data centre infrastructure, while Asia’s footprint is concentrated in a few hubs
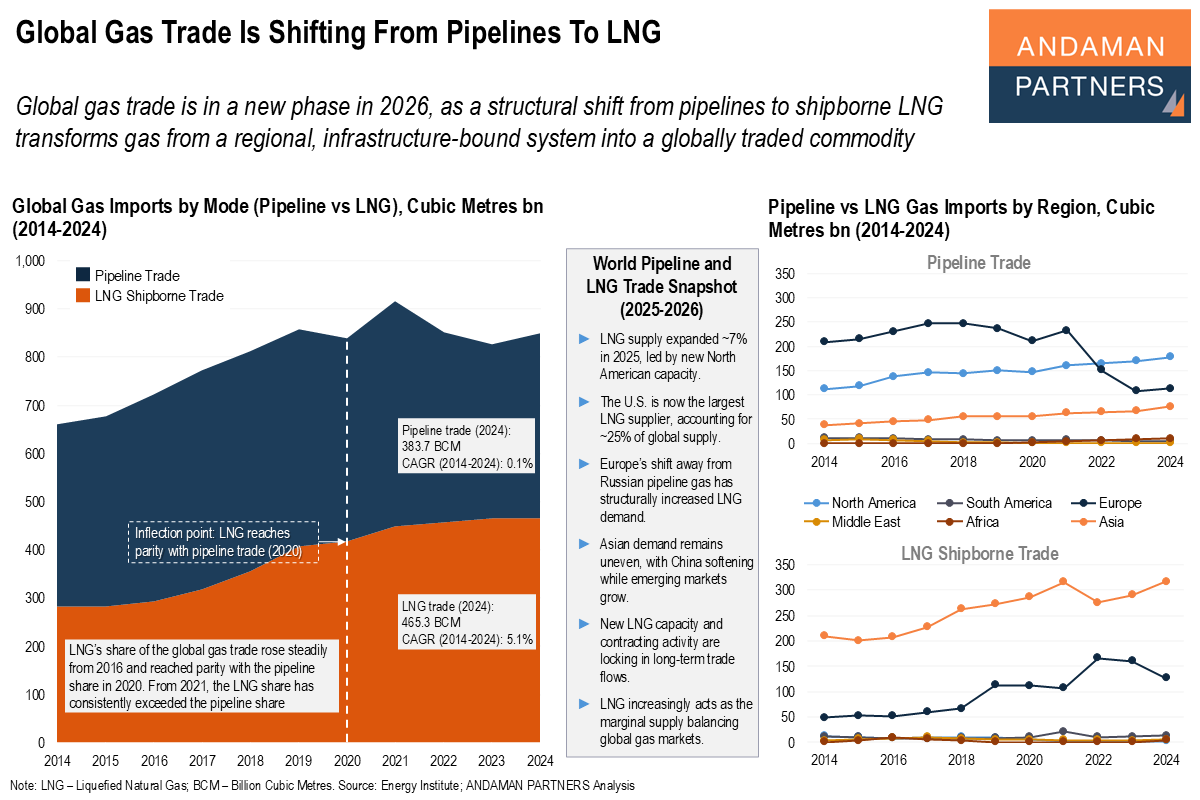
Global gas trade is in a new phase in 2026 amid a structural shift from pipelines to shipborne LNG.
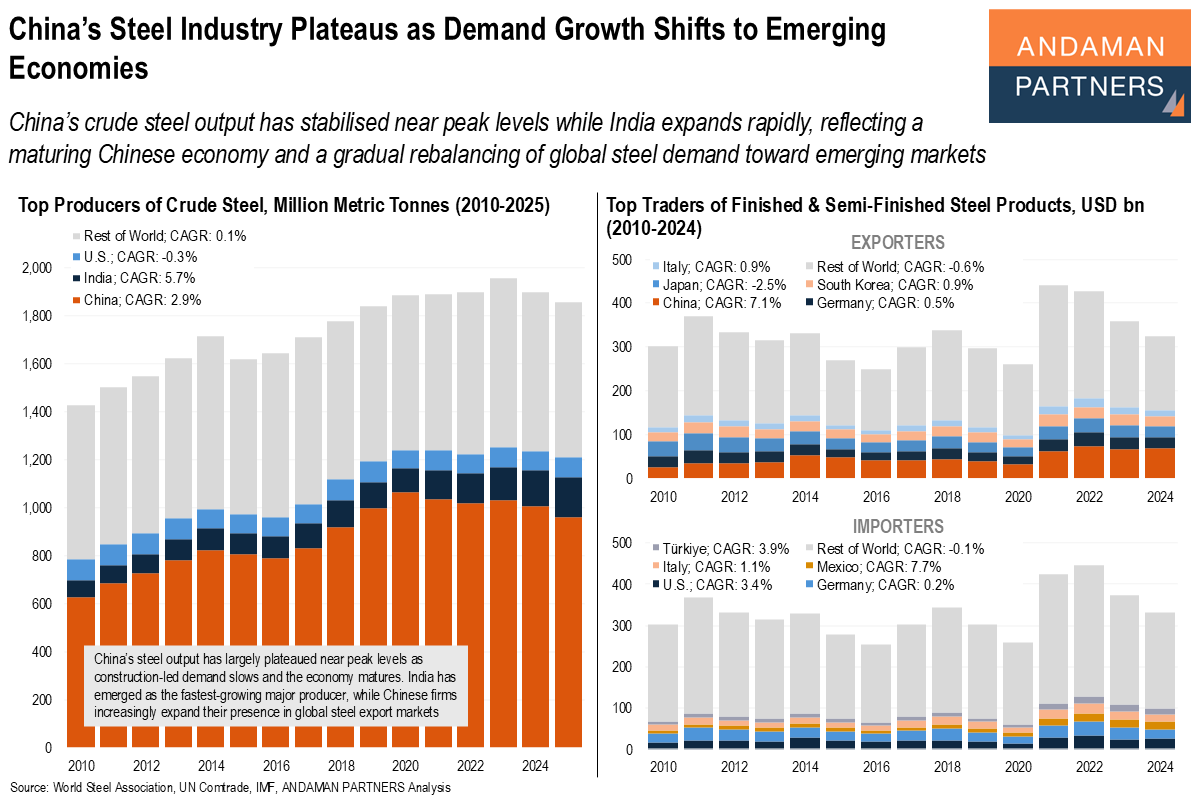
China’s crude steel output has stabilised near peak levels while India expands rapidly, reflecting a gradual rebalancing of global steel demand.
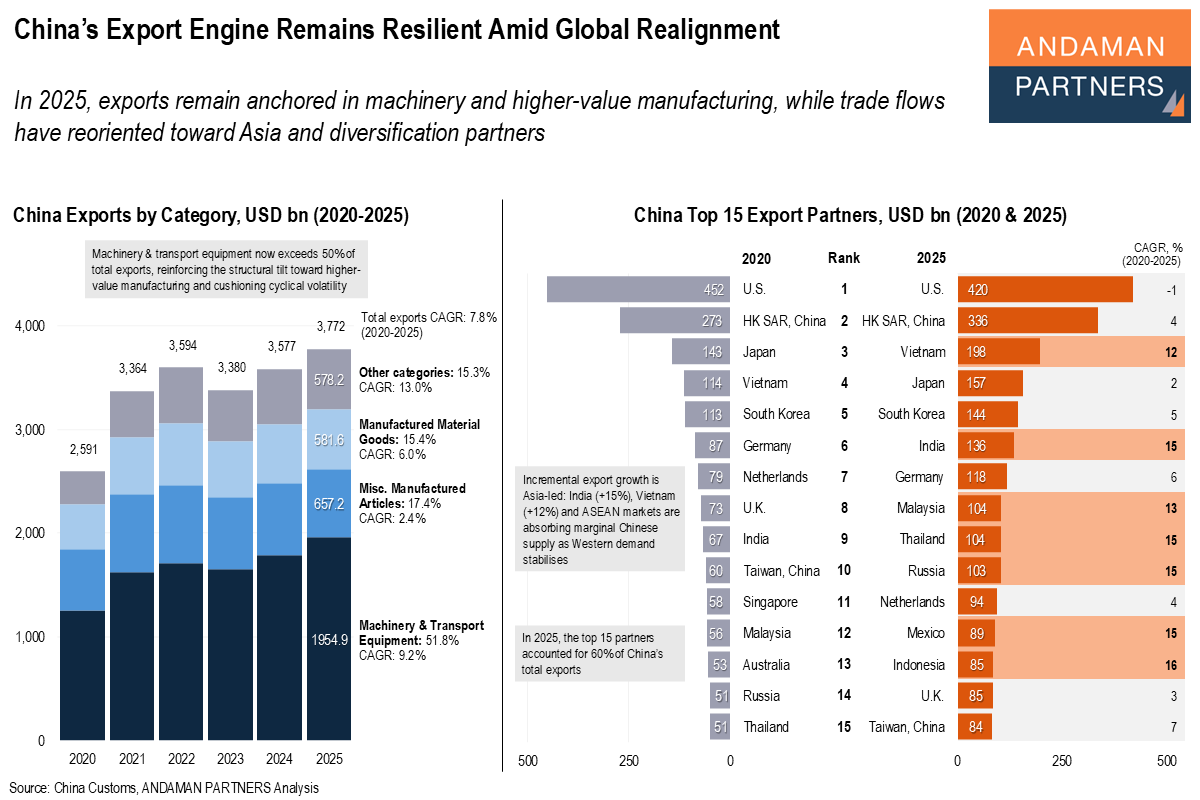
Exports remain anchored in machinery and higher-value manufacturing, while trade flows have reoriented toward Asia and diversification partners.
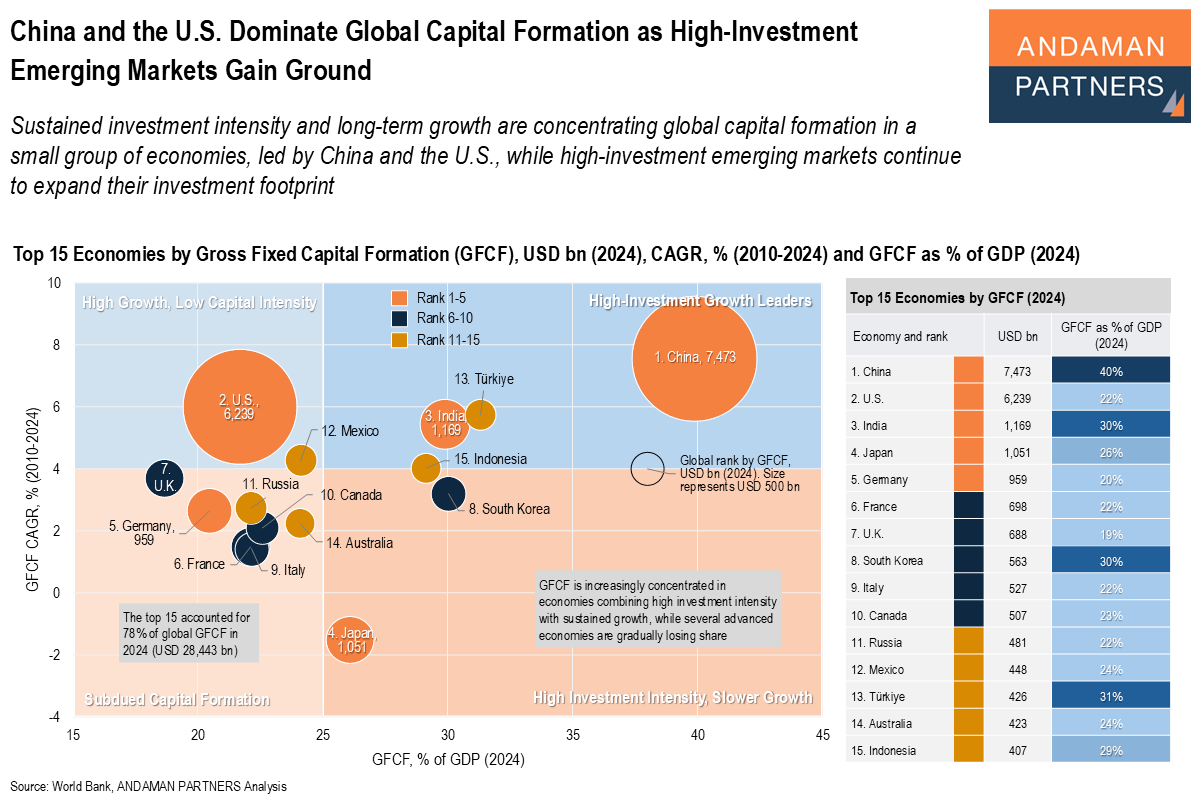
Sustained investment intensity and long-term growth are concentrating global capital formation in a small group of economies, led by China and the U.S.
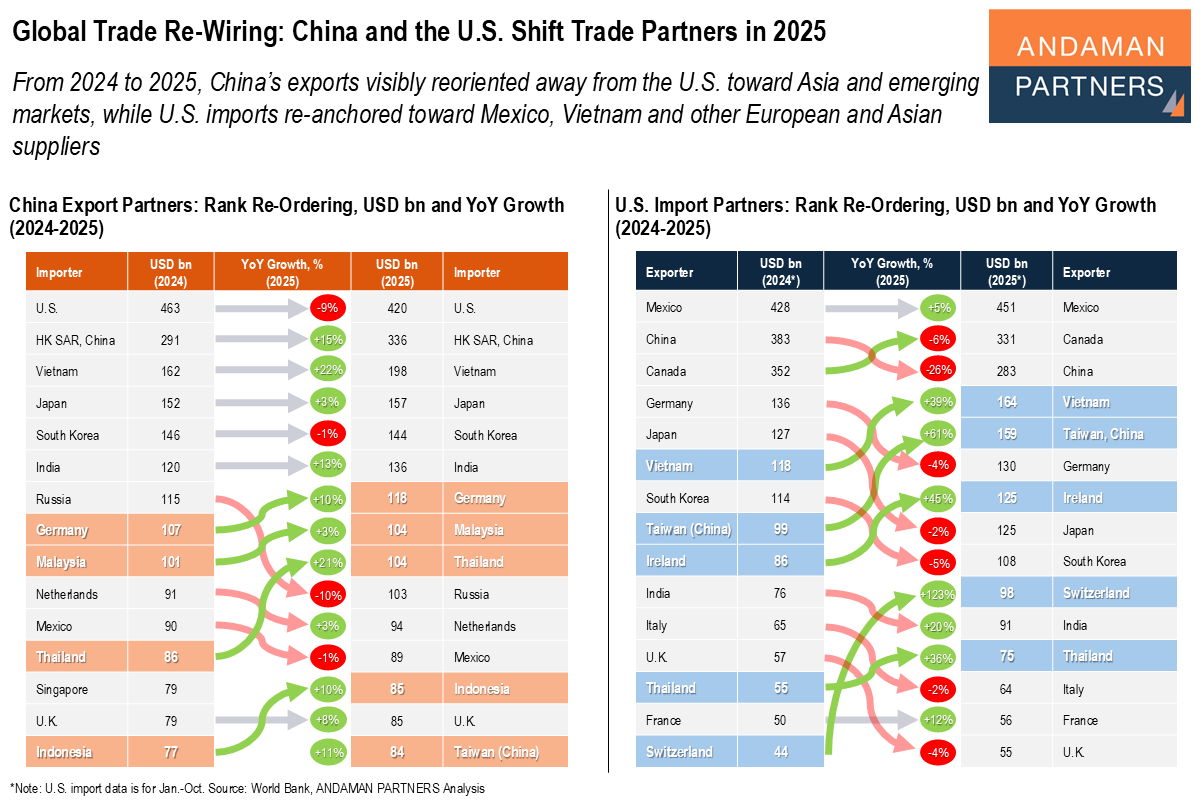
China’s exports reoriented away from the U.S. toward Asia and emerging markets, while U.S. imports re-anchored toward Mexico, Europe and Asia.