
ANDAMAN PARTNERS Co-Founder Rachel Wu to Deliver Talk at SEP Reunion 2026 in Shanghai, China
ANDAMAN PARTNERS will attend the SEP Reunion 2026 in Shanghai, China, from 28 October to 1 November 2026

ANDAMAN PARTNERS will attend the SEP Reunion 2026 in Shanghai, China, from 28 October to 1 November 2026

ANDAMAN PARTNERS will attend the SEP Reunion 2026 in Shanghai, China, from 28 October to 1 November 2026
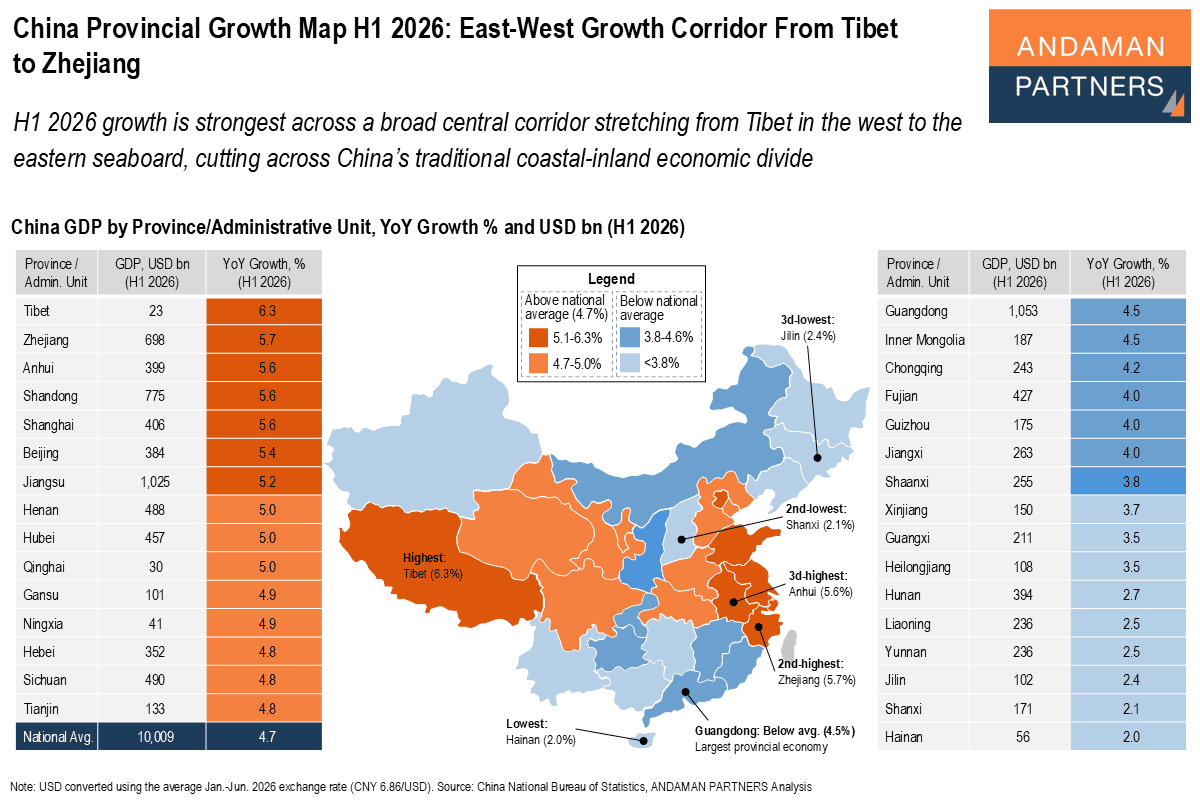
H1 2026 growth is strongest across a broad central corridor stretching from Tibet in the west to the eastern seaboard
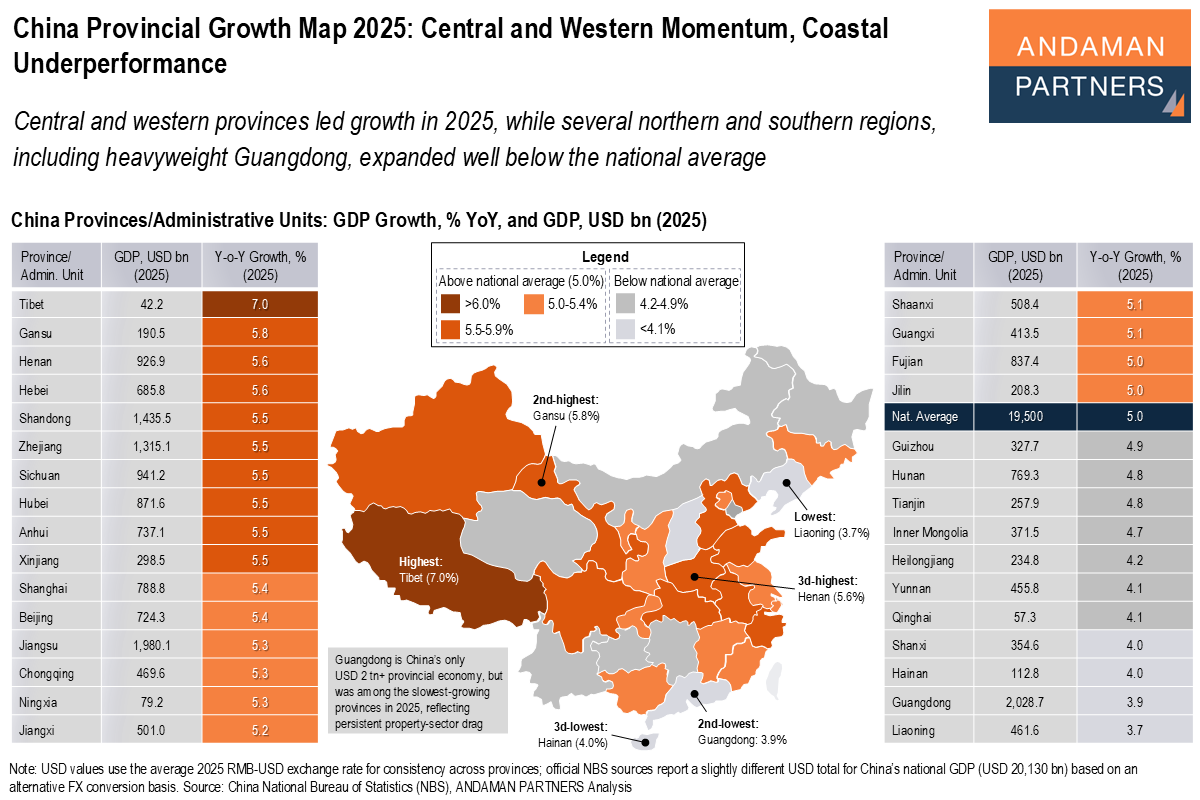
Central and western provinces led growth in 2025, while several northern and southern regions expanded well below the national average.
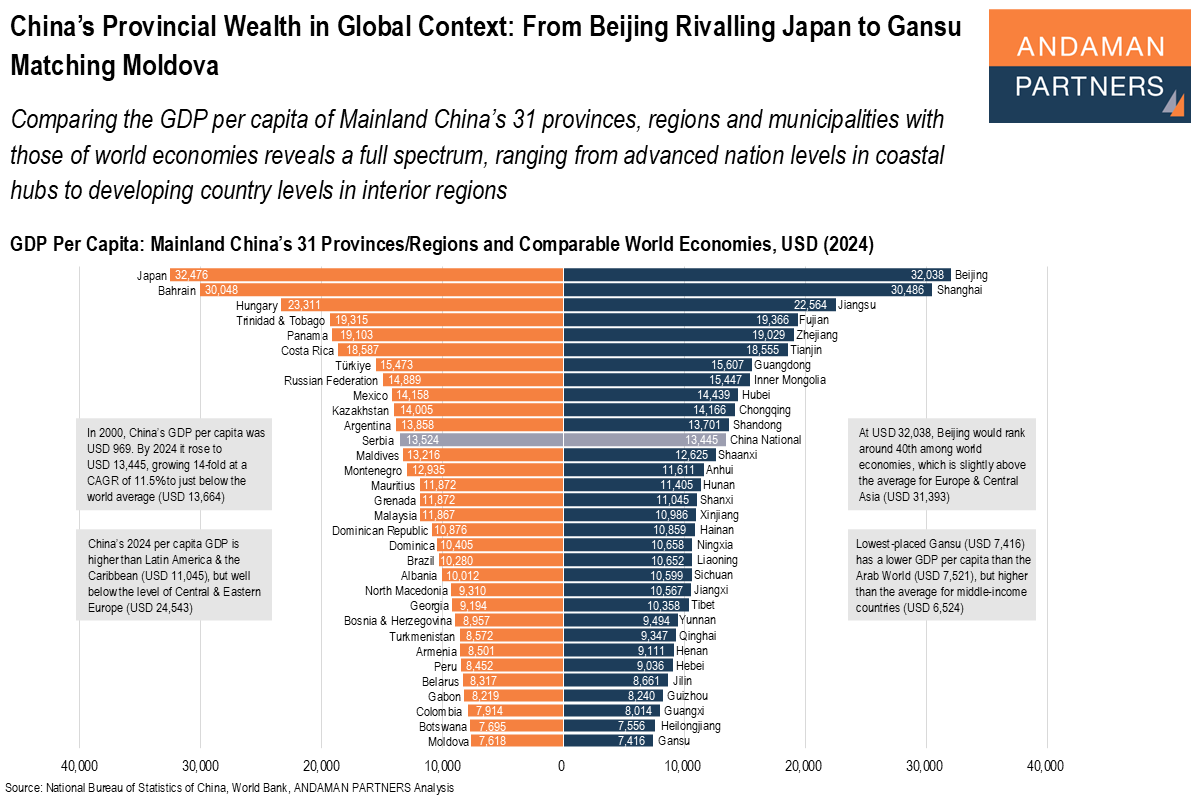
Comparing the GDP per capita of China’s provinces with those of world economies reveals a full spectrum, from advanced to developing country levels.

China leads the world with a total of 16 cities with populations exceeding 10 million people, the ‘megacities’ where talent, capital and infrastructure are concentrated.
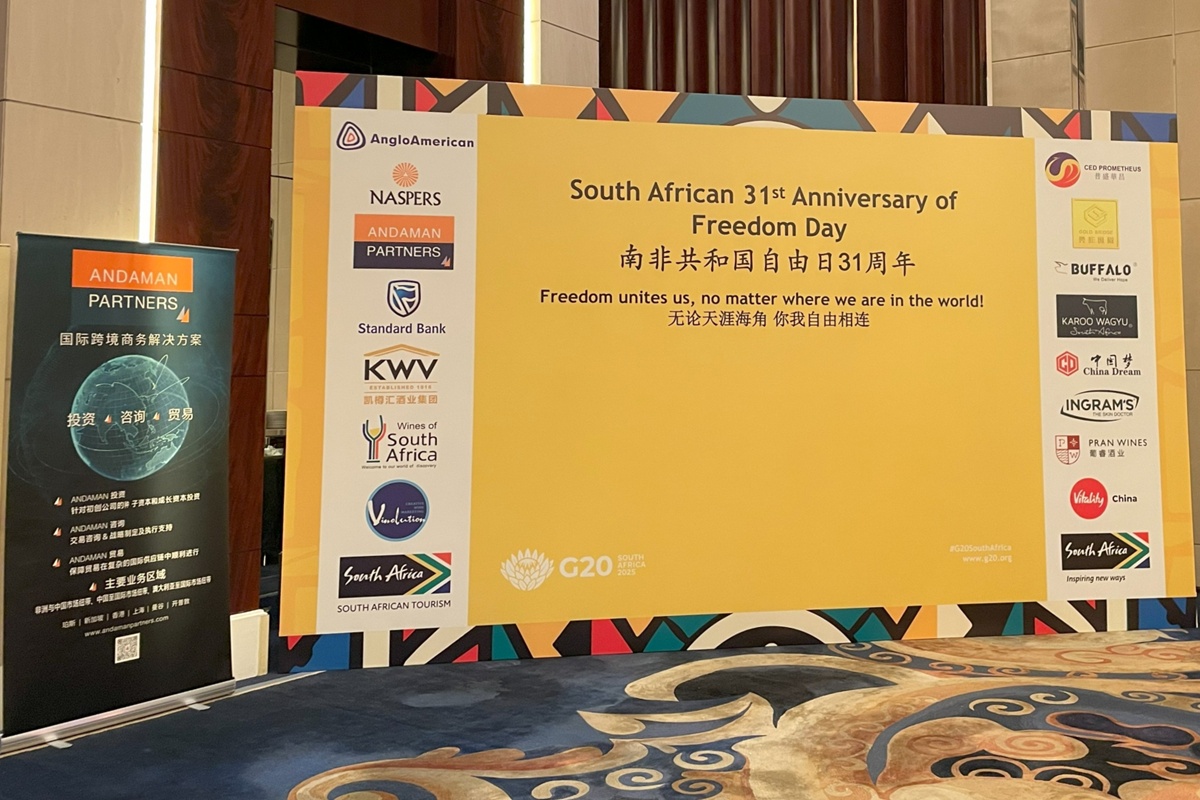
ANDAMAN PARTNERS was a cosponsor of the South African National Day Reception in Shanghai on 30 May 2025.