Africa’s Trade Is Shifting Increasingly Toward China
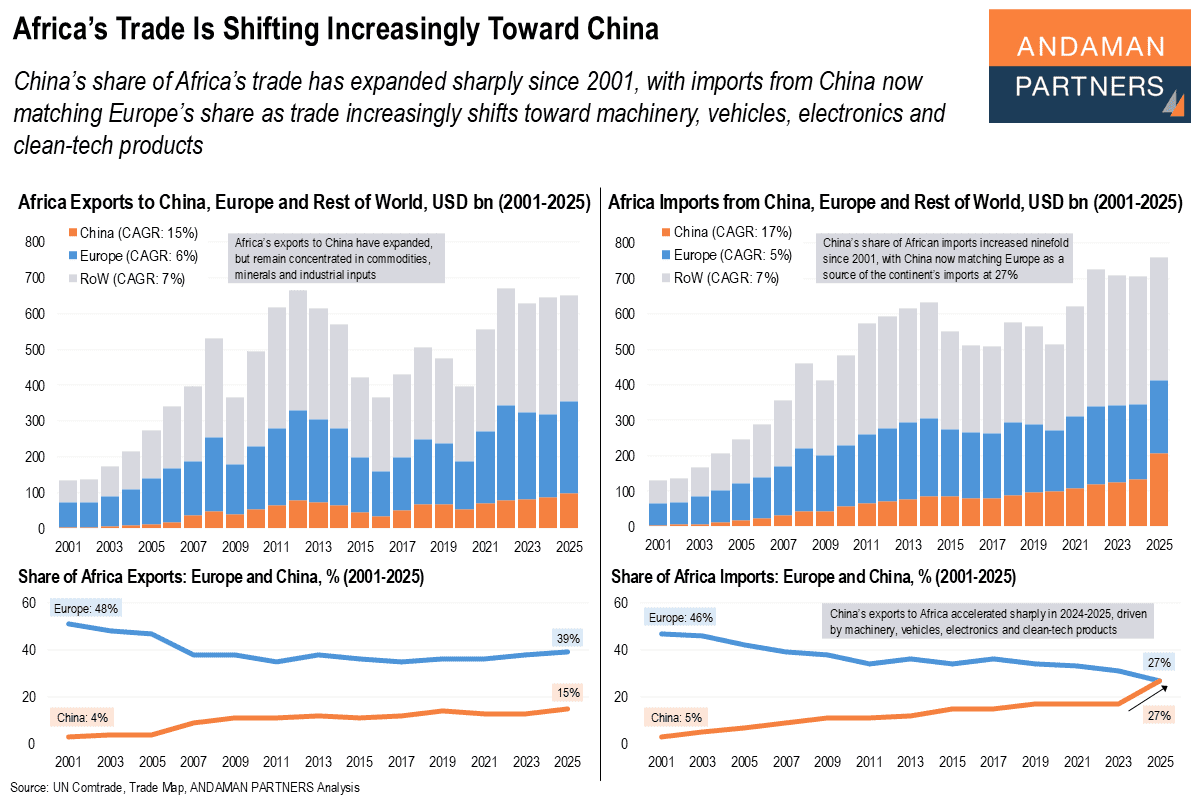
China’s share of Africa’s trade has expanded sharply since 2001, with imports from China now matching Europe’s share
China’s share of Africa’s trade has expanded sharply since 2001, with imports from China now matching Europe’s share
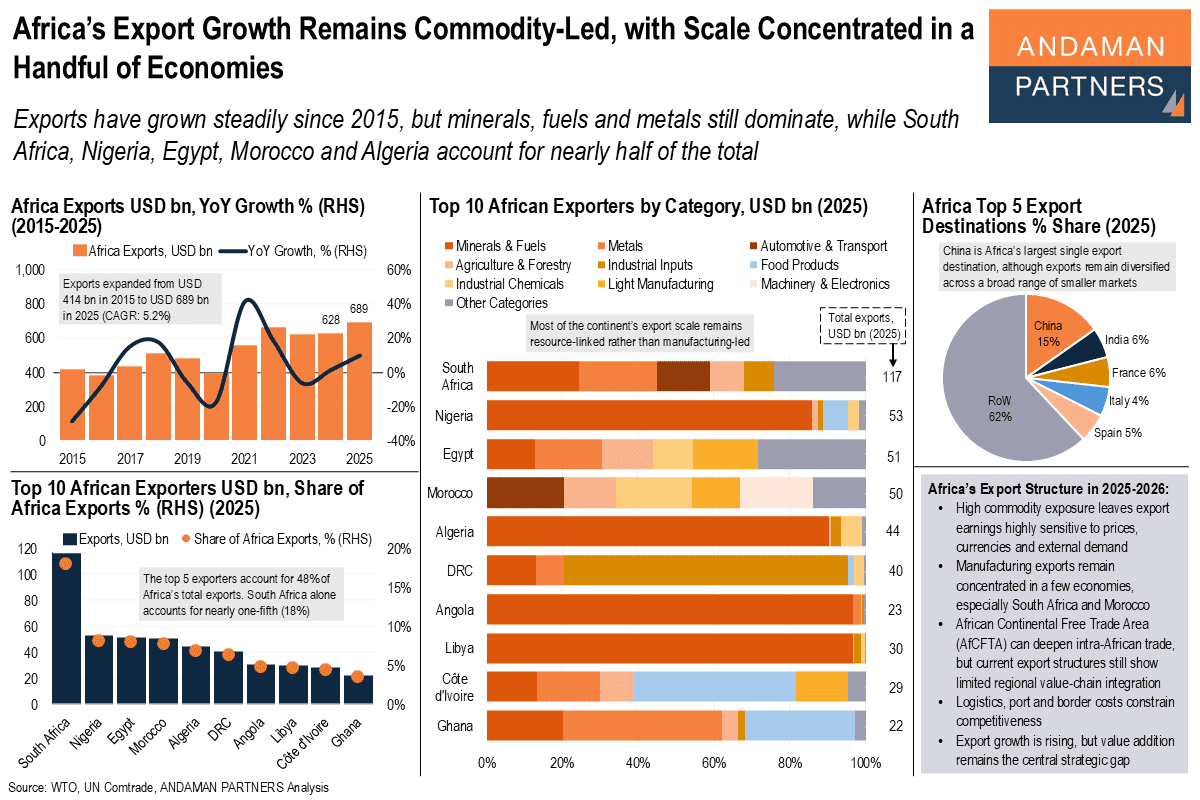
Exports have grown steadily since 2015, but minerals, fuels and metals still dominate, while five countries account for half of the total
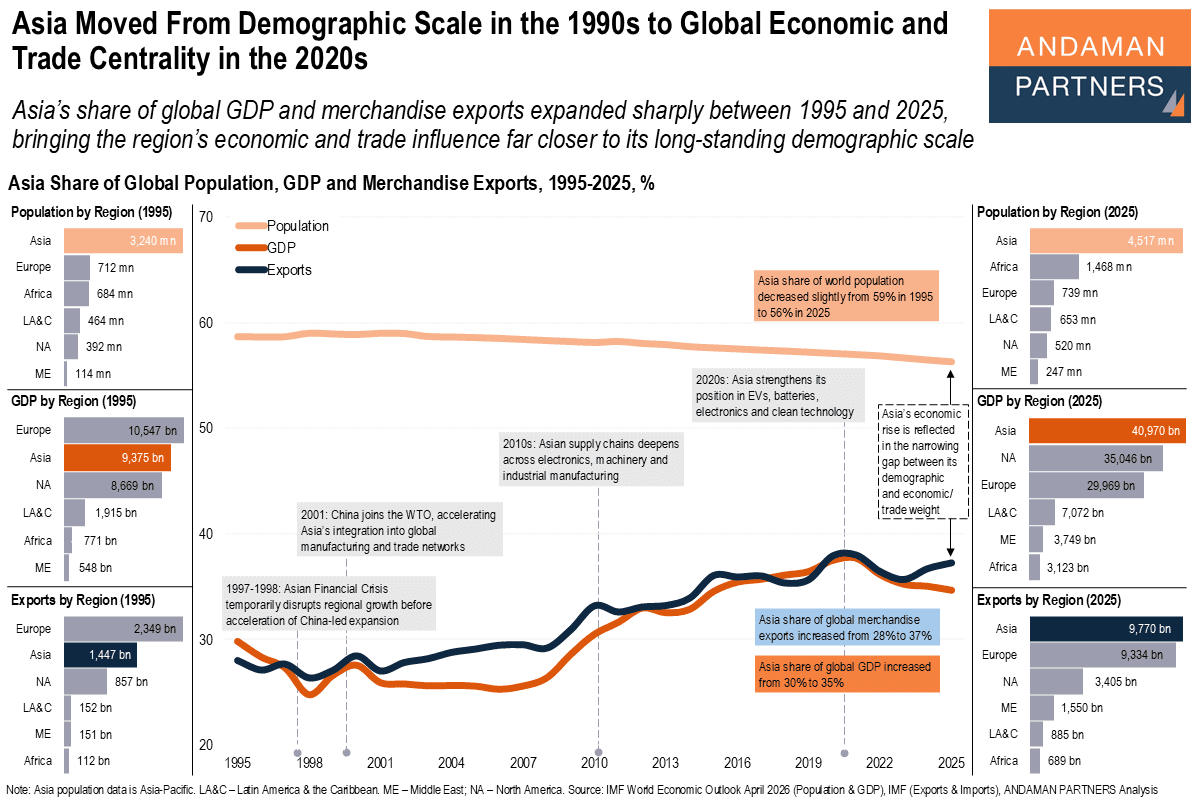
Asia’s share of global GDP and exports expanded sharply to 2025, bringing the region’s influence closer to its demographic scale.
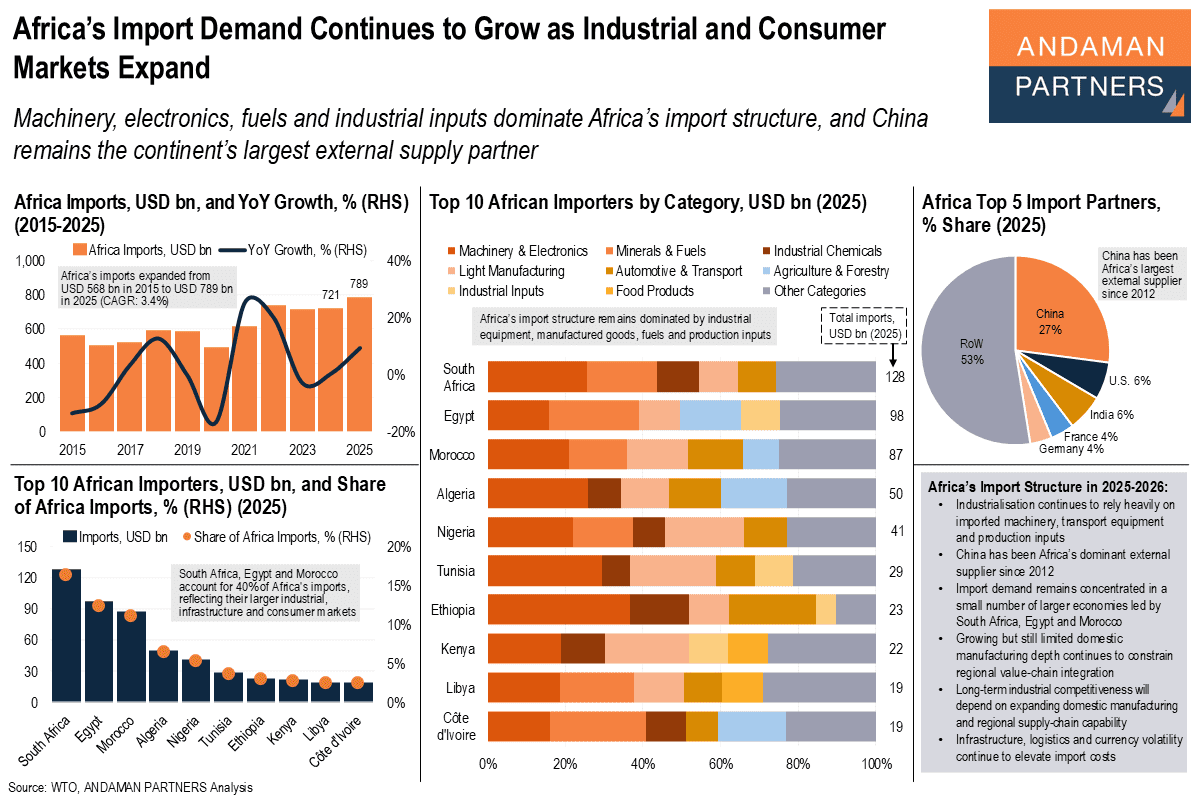
Machinery, electronics, fuels and industrial inputs dominate Africa’s imports, and China remains the continent’s largest supplier
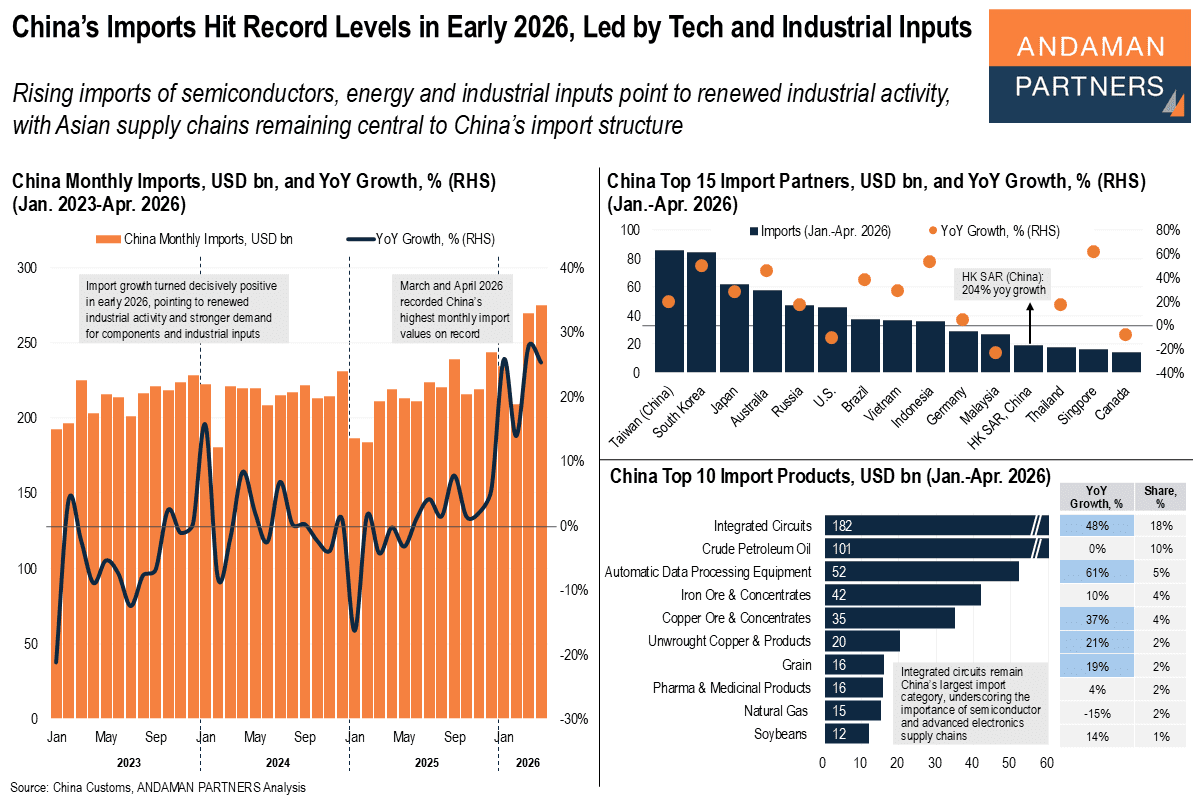
Rising imports of semiconductors, energy and industrial inputs point to renewed industrial activity.
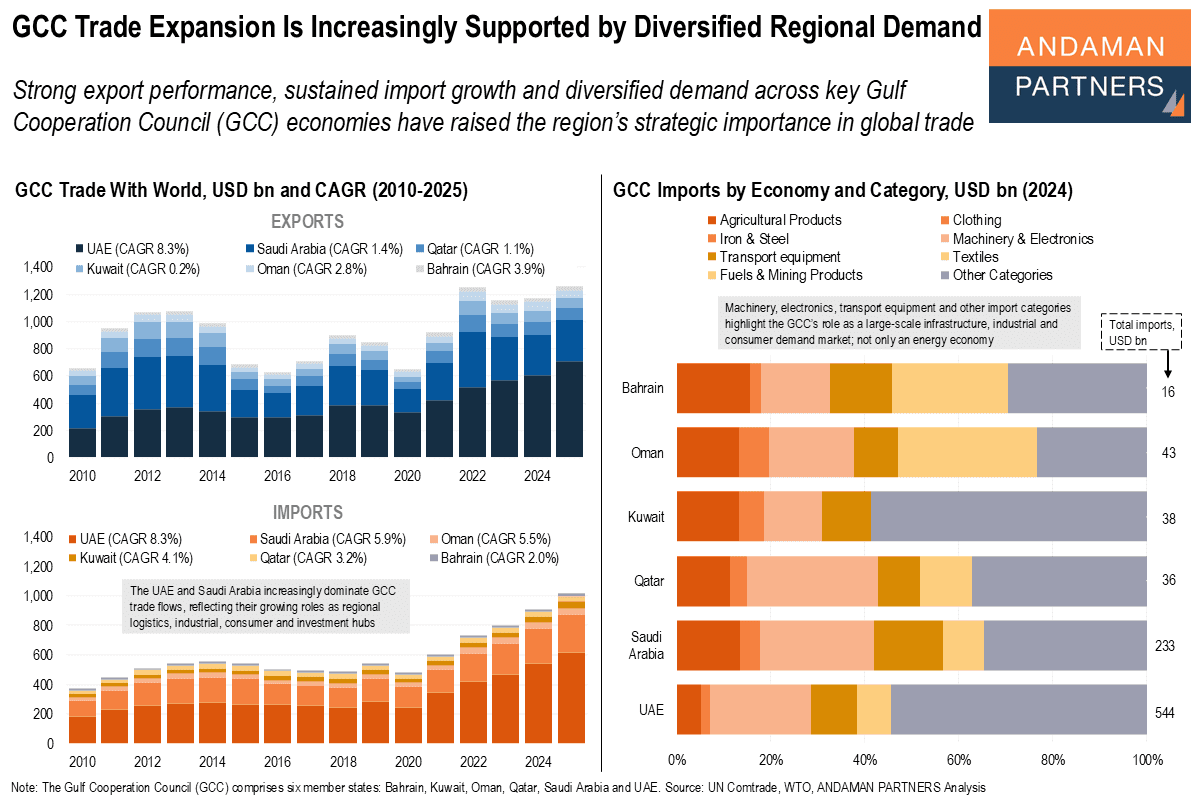
Strong export performance, sustained import growth and diversified demand across the GCC have raised the region’s strategic importance.
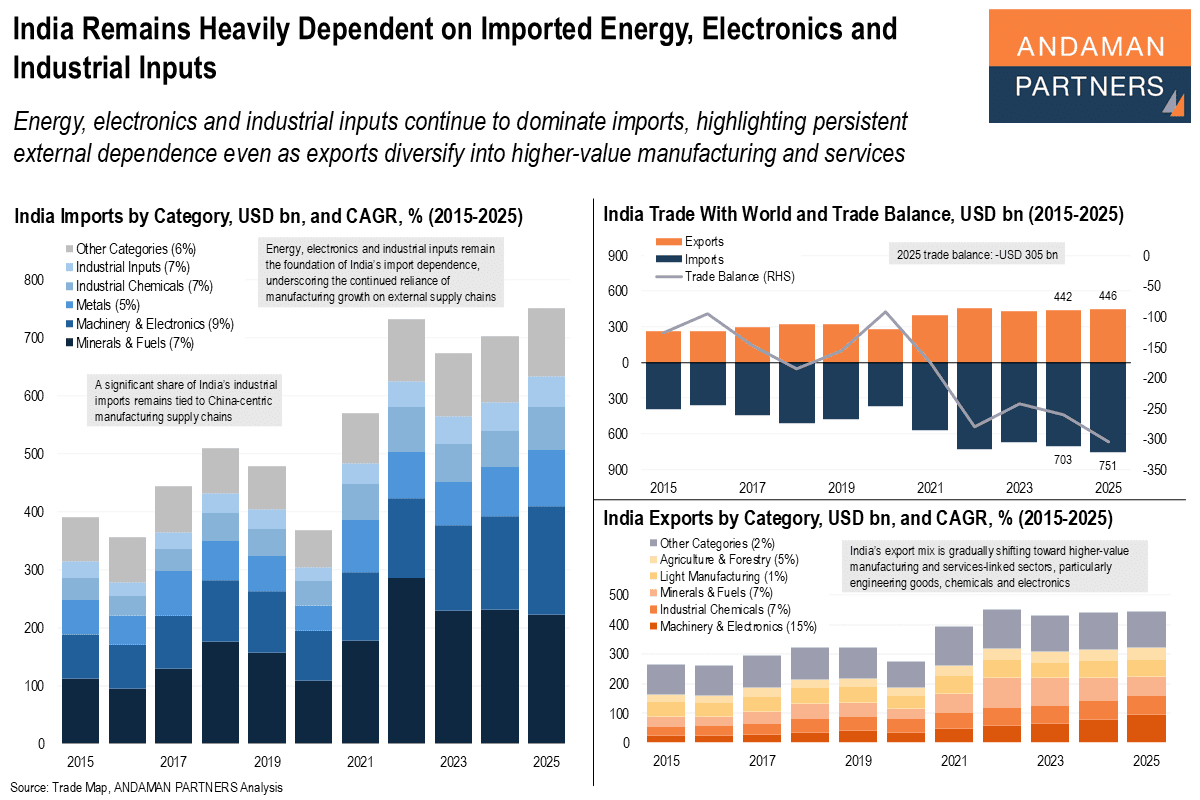
Energy, electronics and industrial inputs continue to dominate India's imports, highlighting persistent external dependence.
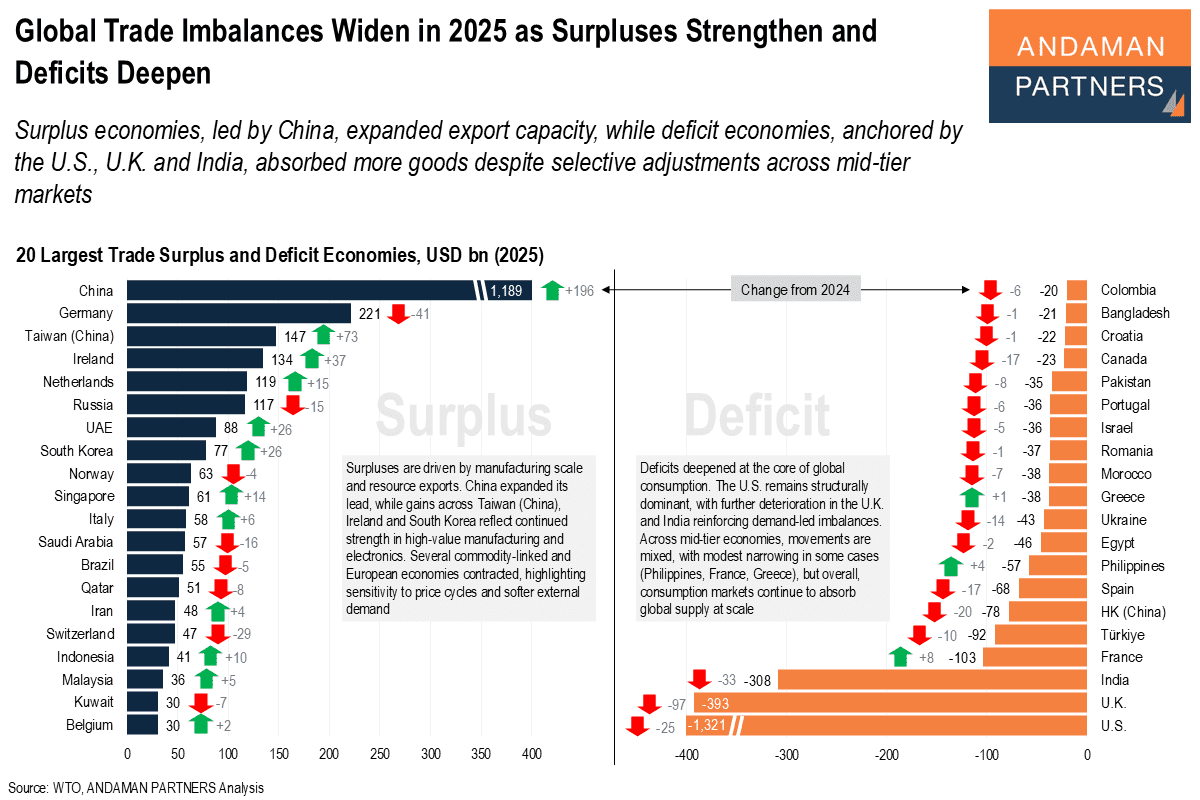
Surplus economies expanded export capacity, while deficit economies absorbed more goods despite selective adjustments across mid-tier markets.
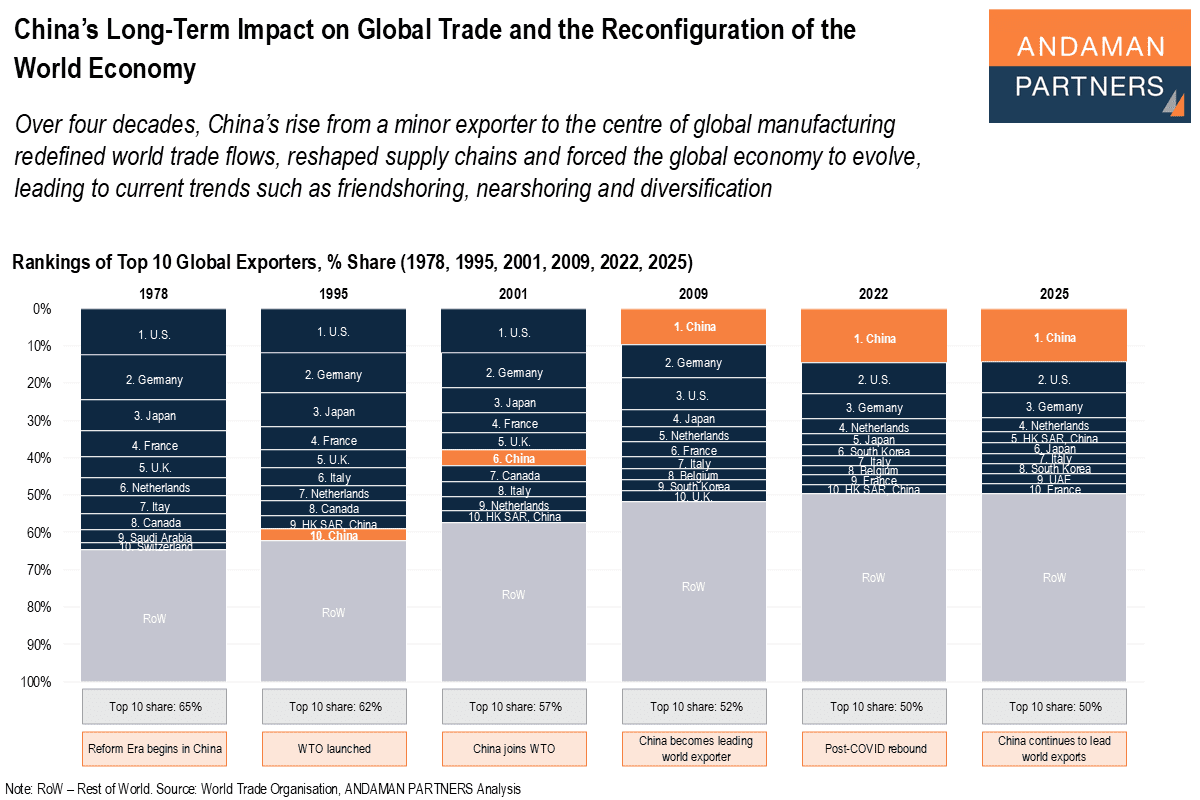
China’s rise from a minor exporter to the centre of global manufacturing redefined trade flows, reshaped supply chains and forced the global economy to evolve.
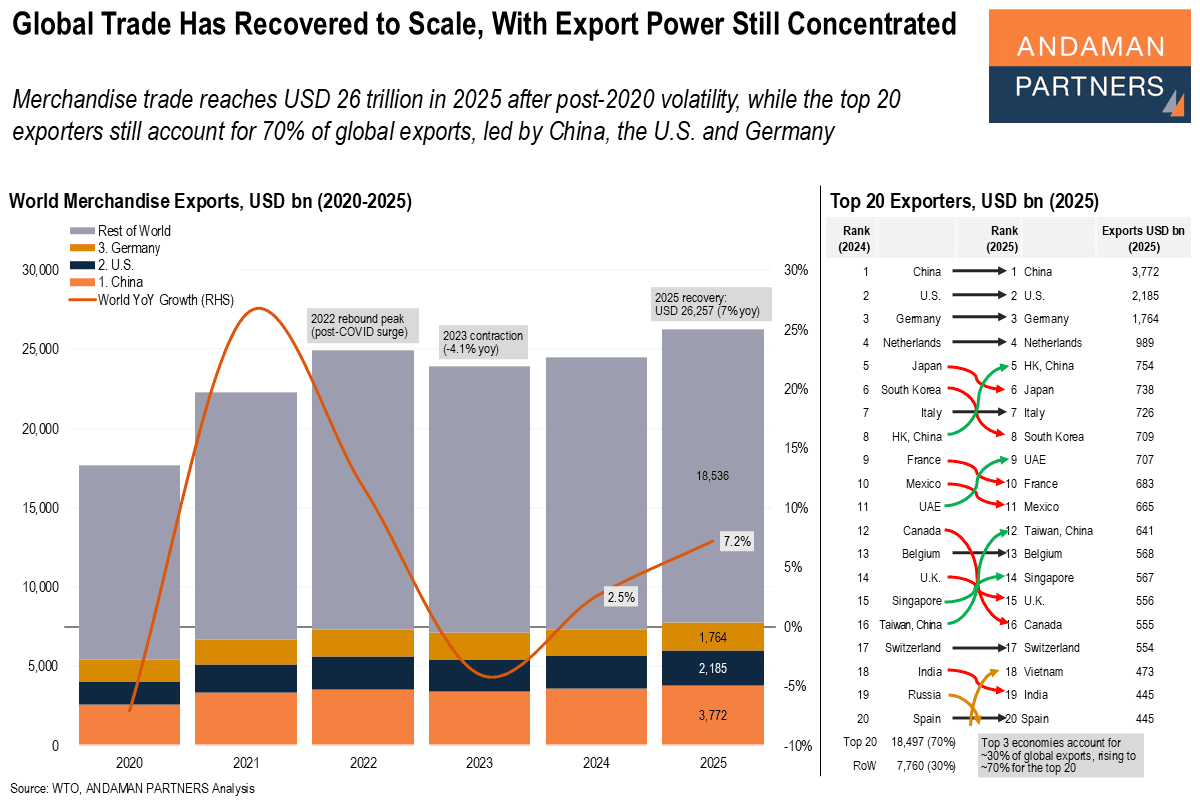
Merchandise trade reaches USD 26 trillion in 2025, while the top 20 exporters account for 70% of global exports.