China’s Steel Industry Plateaus as Demand Growth Shifts to Emerging Economies
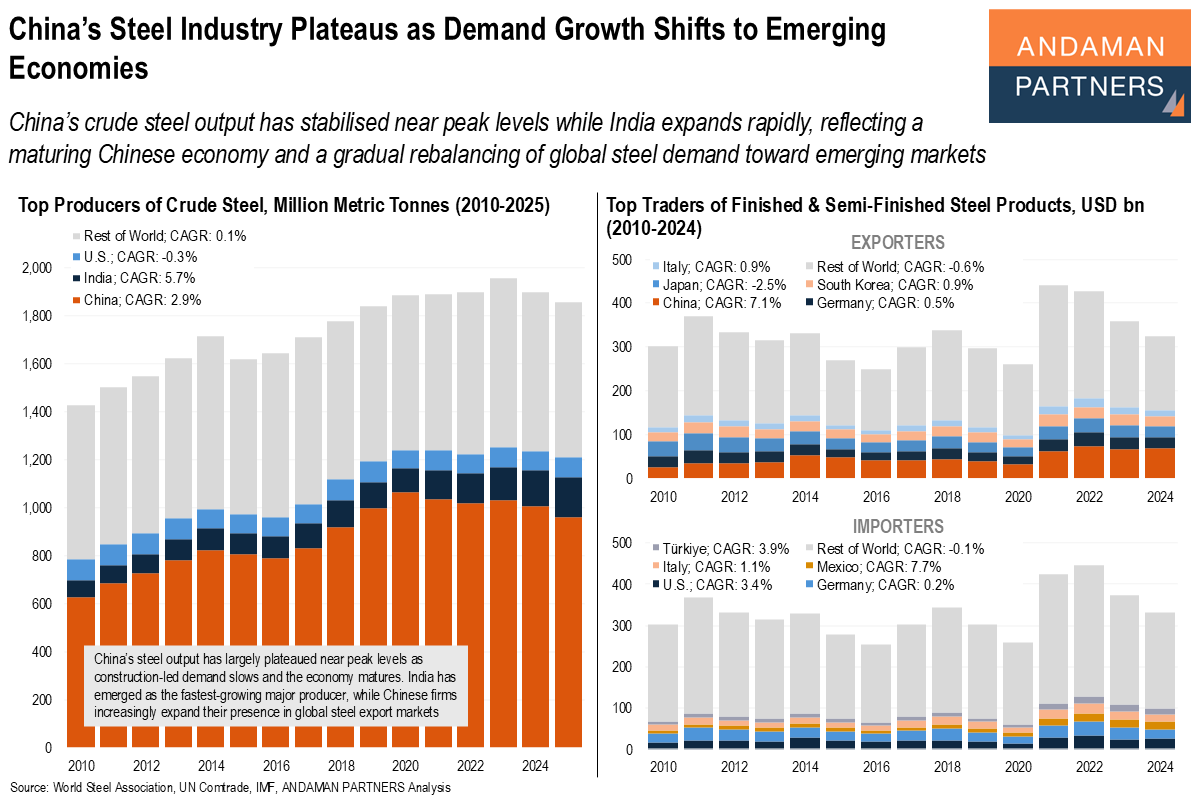
China’s crude steel output has stabilised near peak levels while India expands rapidly, reflecting a gradual rebalancing of global steel demand.
China’s crude steel output has stabilised near peak levels while India expands rapidly, reflecting a gradual rebalancing of global steel demand.
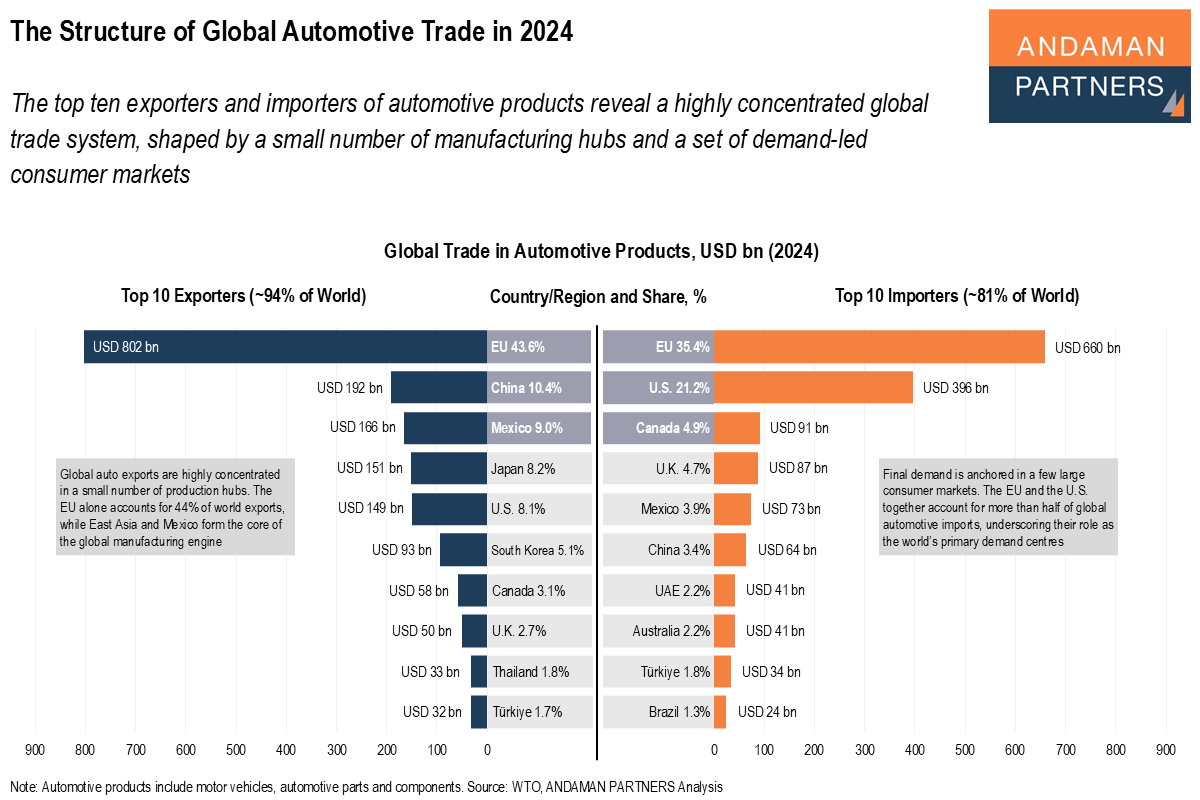
The top ten exporters and importers of automotive products reveal a highly concentrated global trade system.
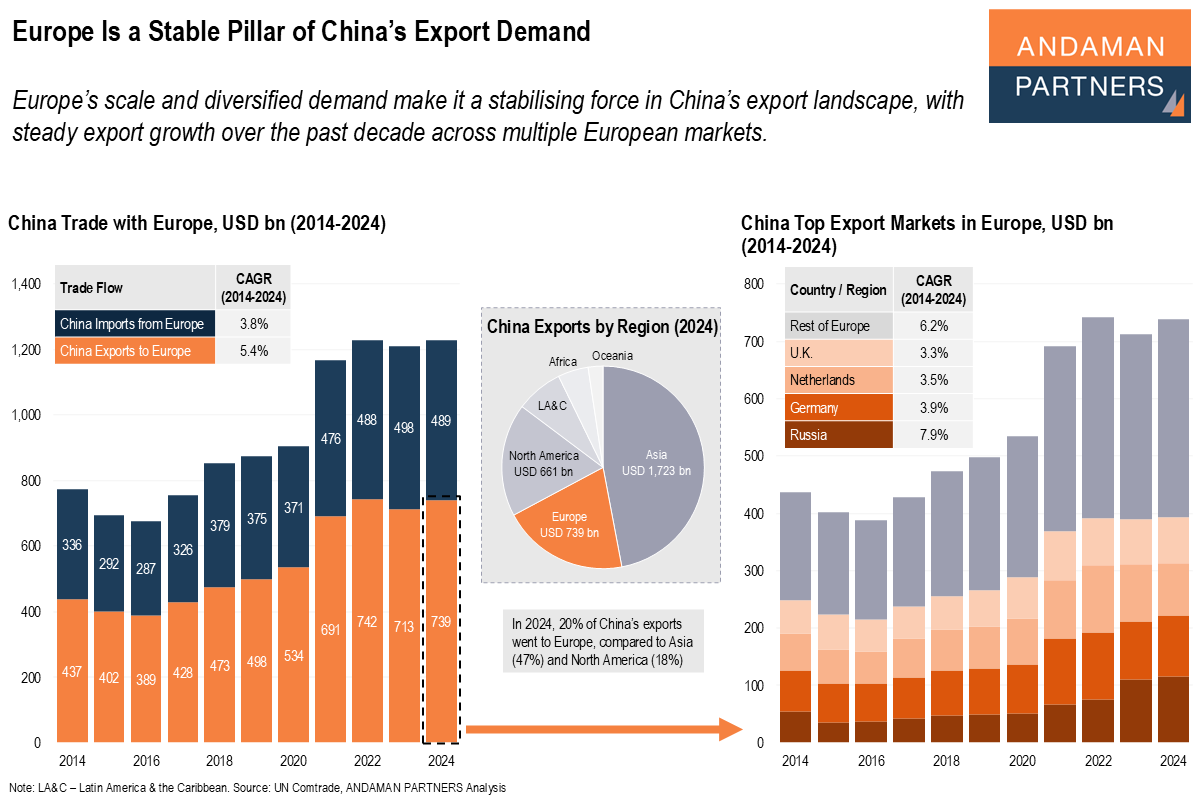
Europe’s scale and diversified demand make it a stabilising force in China’s export landscape, with steady export growth over the past decade.
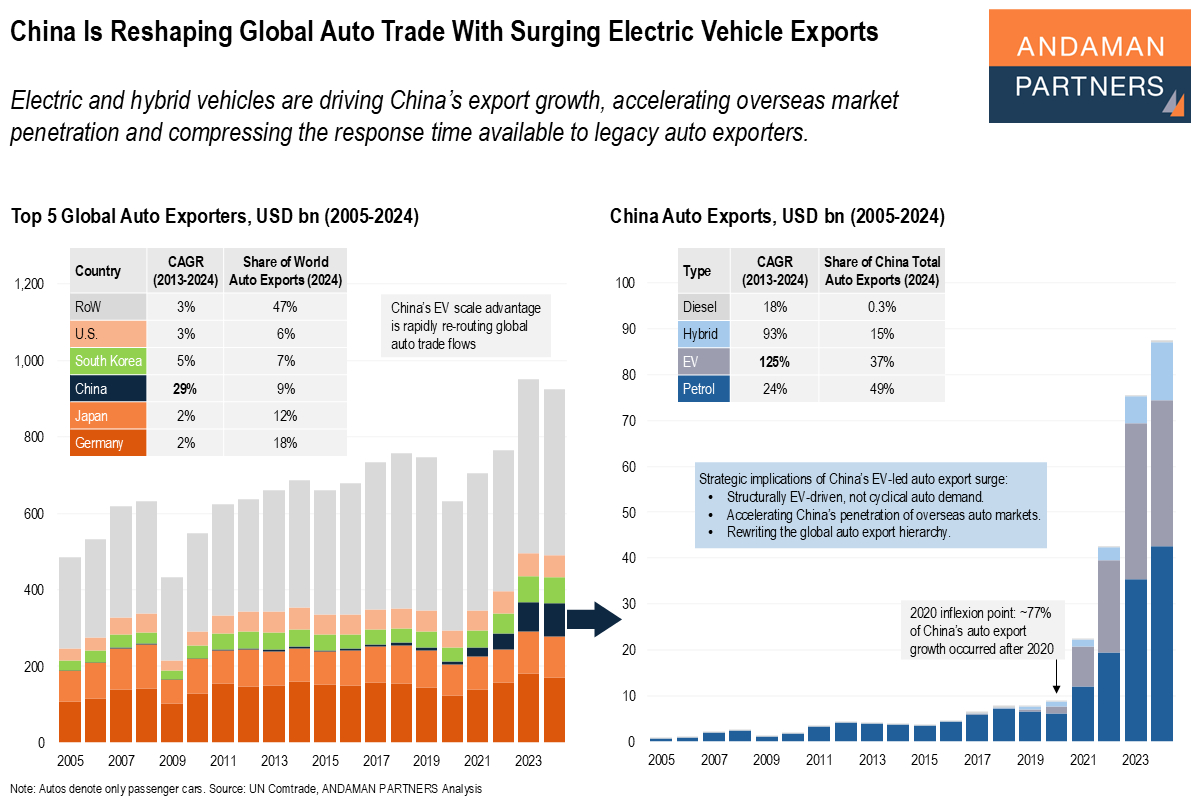
Electric and hybrid vehicles are driving China’s export growth, accelerating overseas market penetration and compressing the response time available to legacy auto exporters.
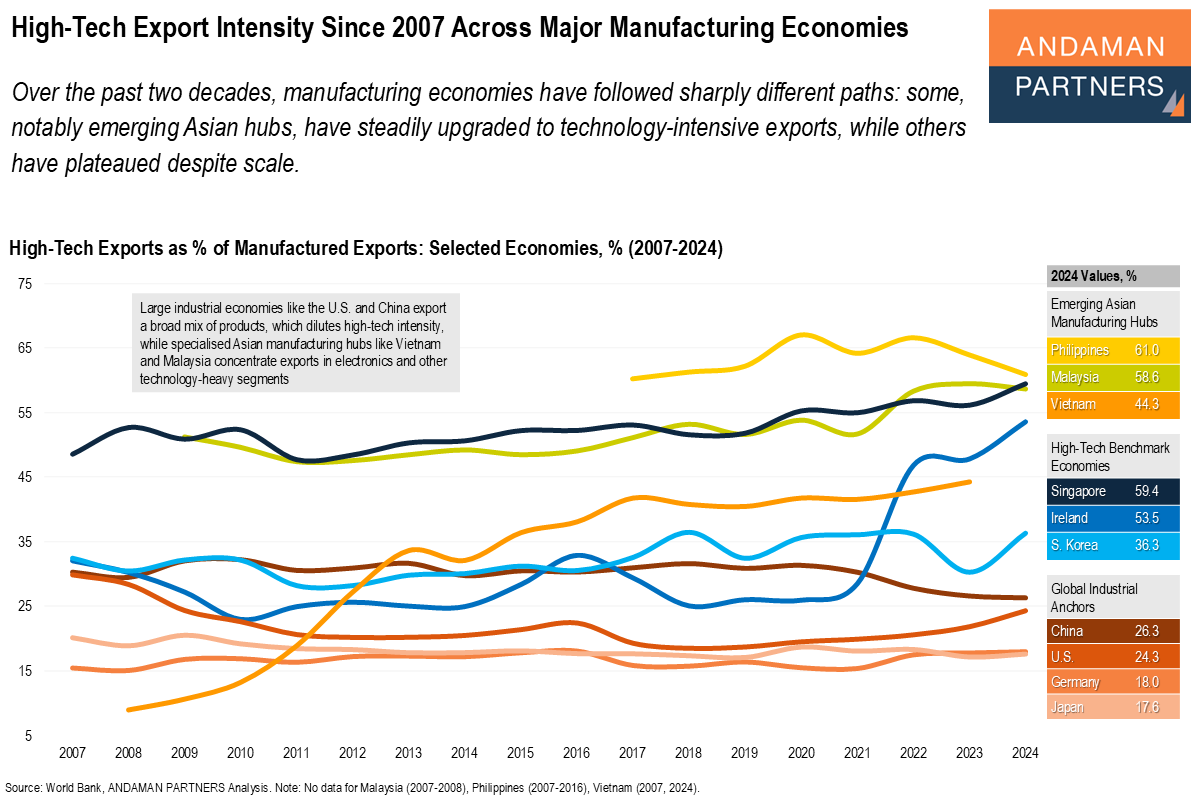
Some manufacturing economies have upgraded to tech-intensive exports while others have plateaued despite scale.
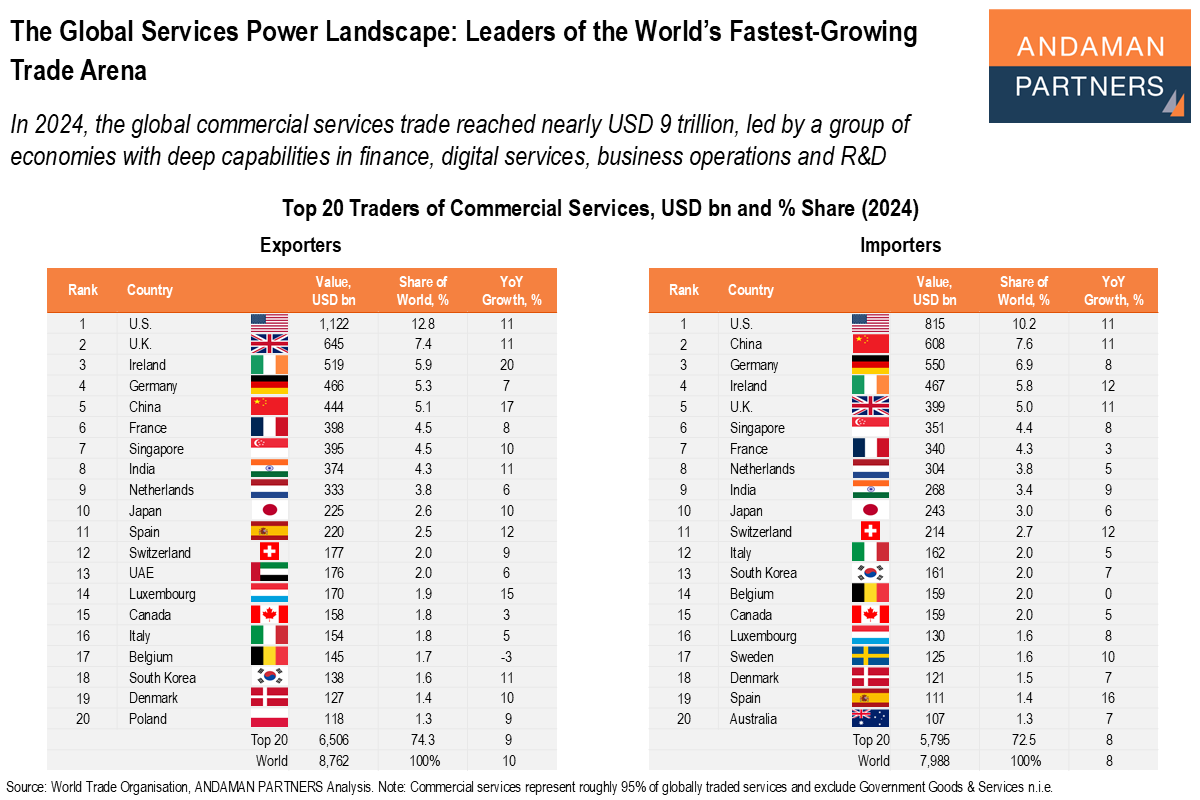
In 2024, the global commercial services trade reached nearly USD 9 trillion, led by a group of economies with deep capabilities.
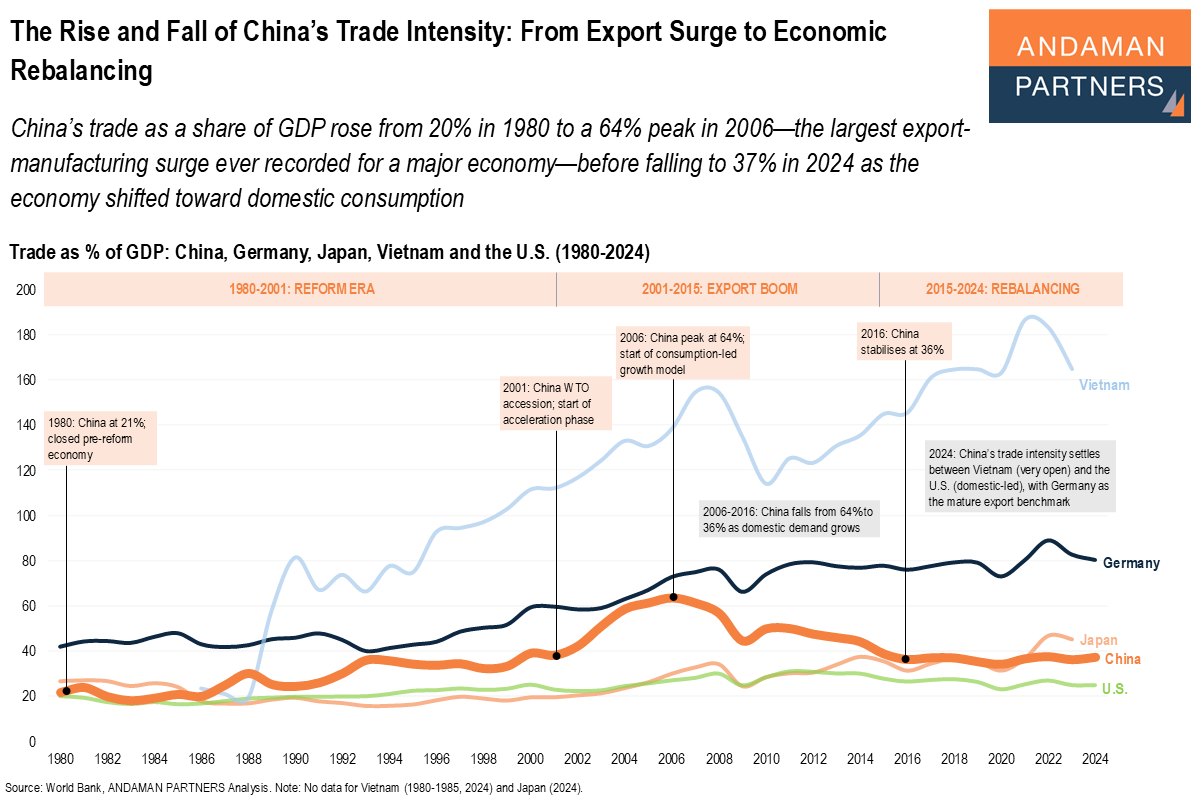
China’s trade as a share of GDP rose from 20% in 1980 to a peak of 64% in 2006 before falling to 37% in 2024 as the economy shifted toward domestic consumption.
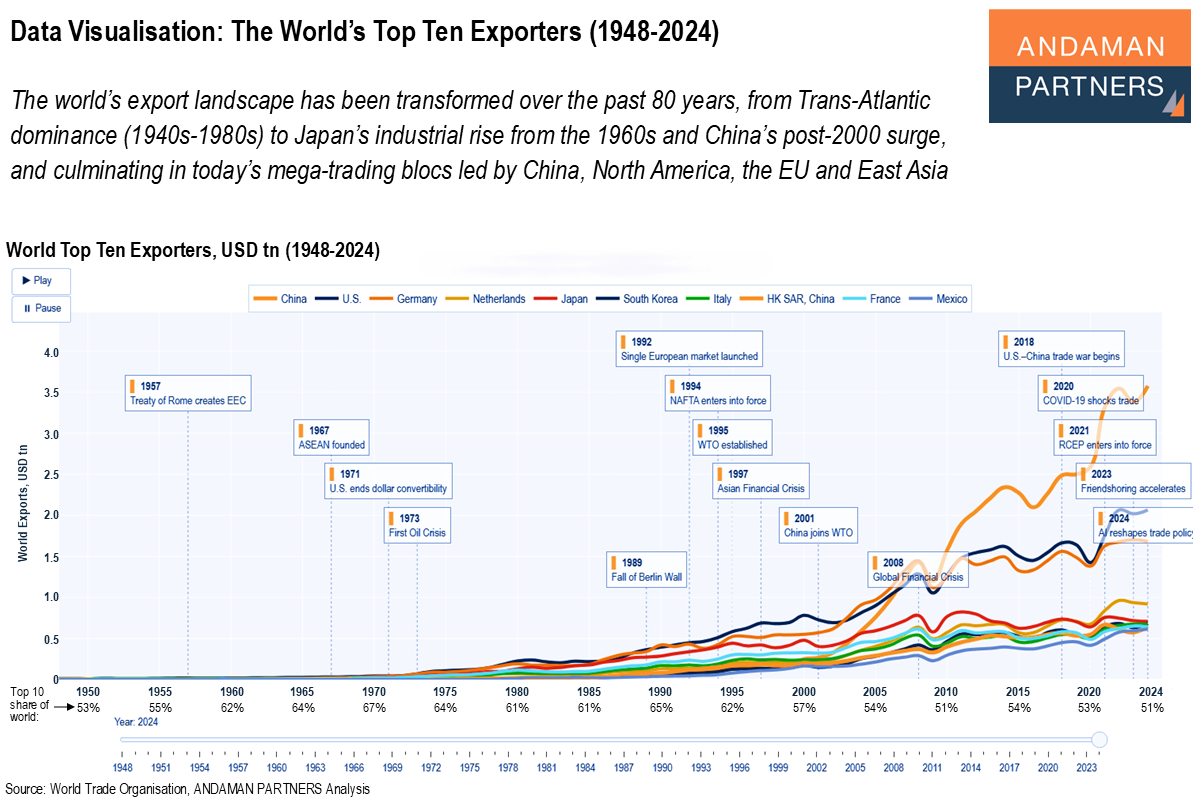
The world’s export landscape has been transformed over the past 80 years, from Trans-Atlantic dominance to Japan’s and China's rise and mega-trading blocs.
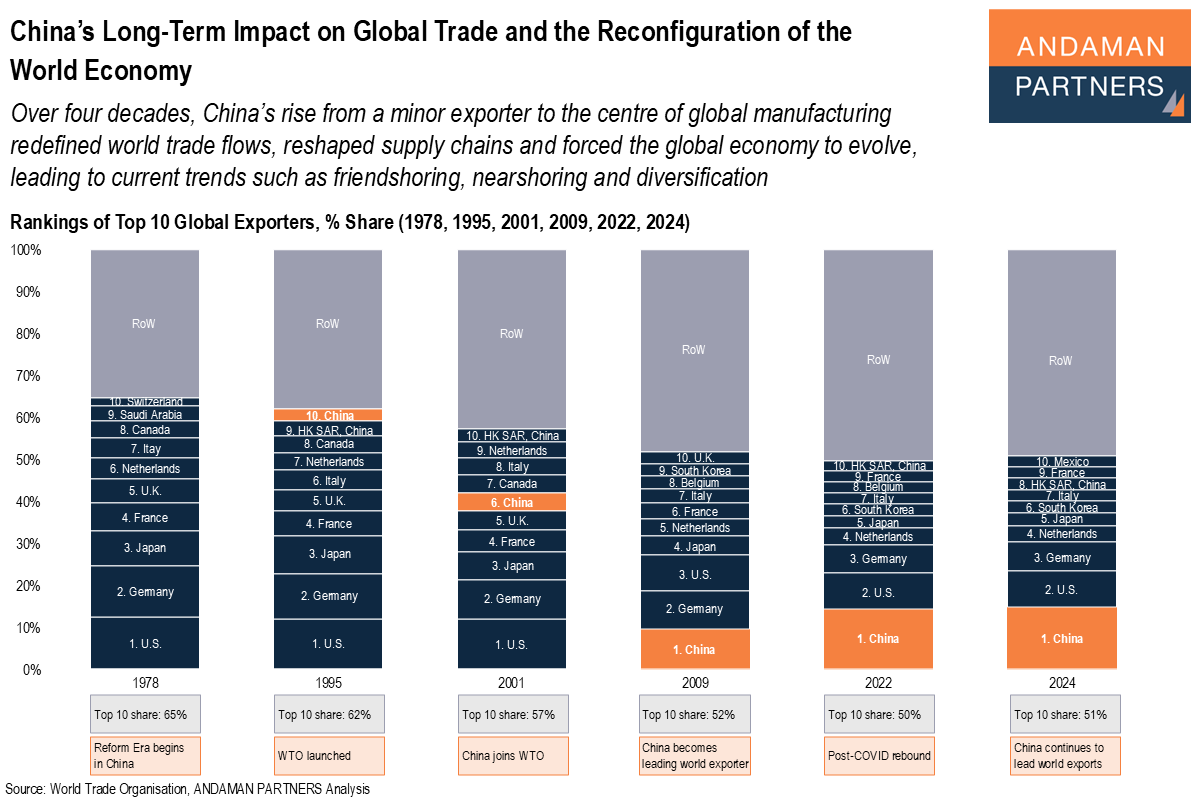
China’s rise from a minor exporter to the centre of global manufacturing redefined world trade flows, reshaped supply chains and forced the global economy to evolve.
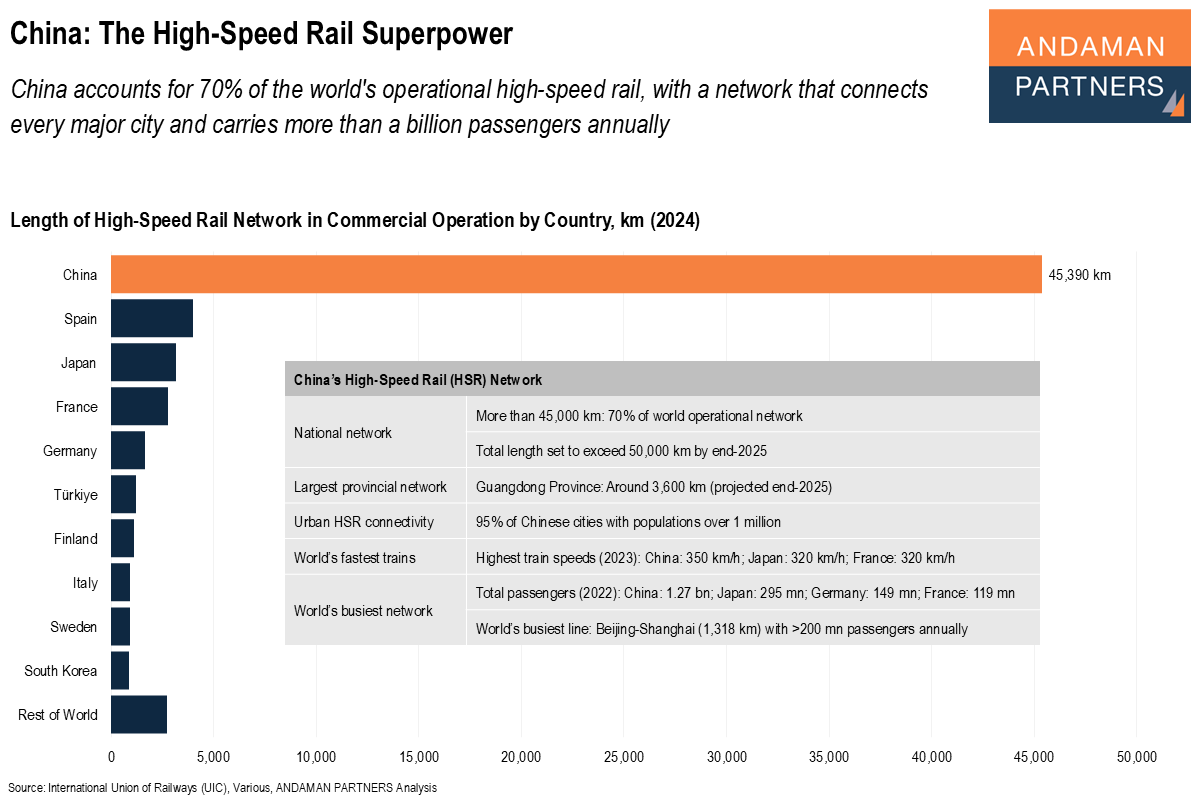
China accounts for 70% of the world's operational high-speed rail, with a network that connects every major city and carries a billion passengers.