ASEAN’s Expanding Export Base, Driven by Electronics and Resources
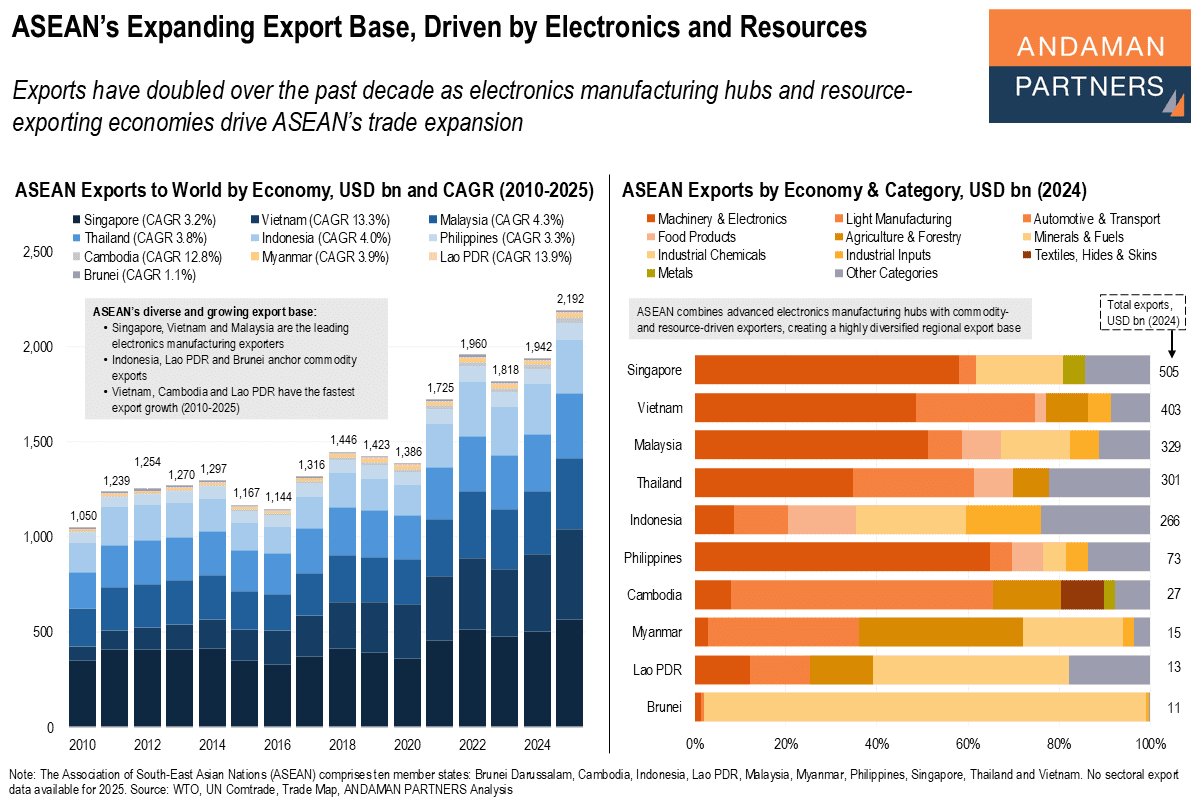
Exports have doubled over the past decade as electronics manufacturing hubs and resource-exporting economies drive ASEAN’s trade expansion.
Exports have doubled over the past decade as electronics manufacturing hubs and resource-exporting economies drive ASEAN’s trade expansion.
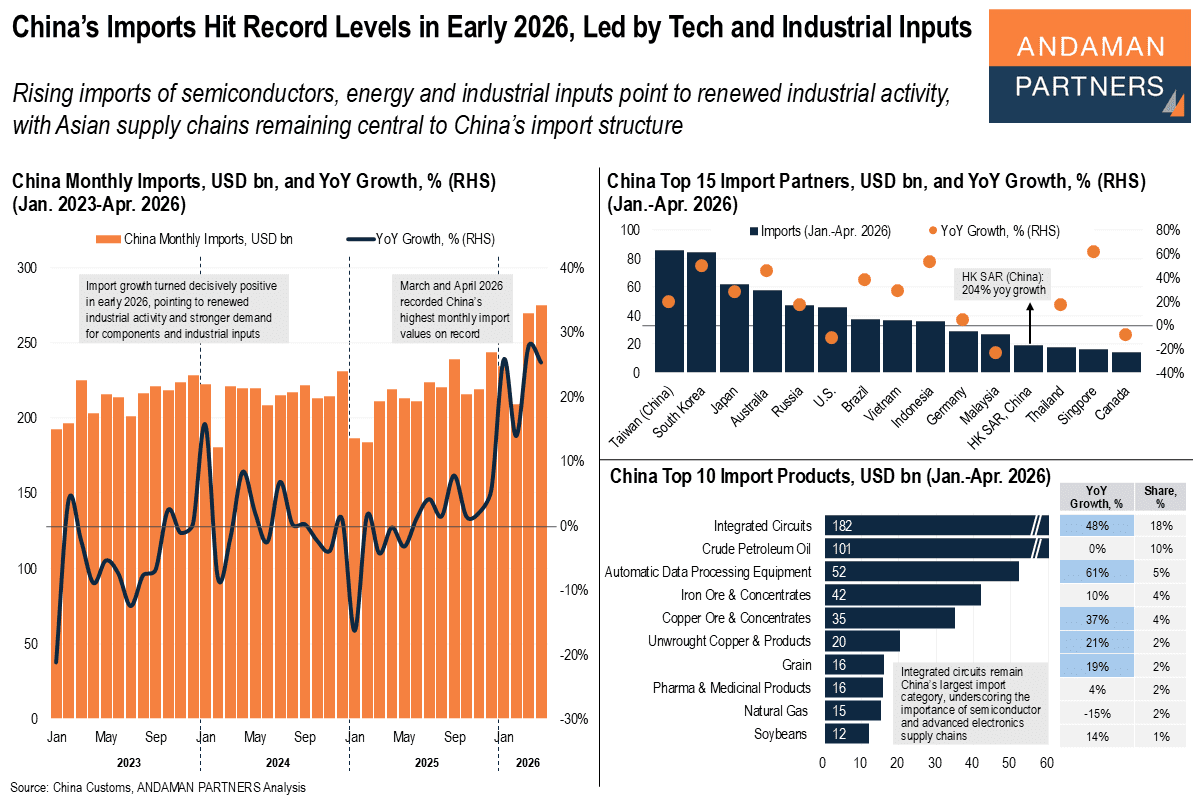
Rising imports of semiconductors, energy and industrial inputs point to renewed industrial activity.
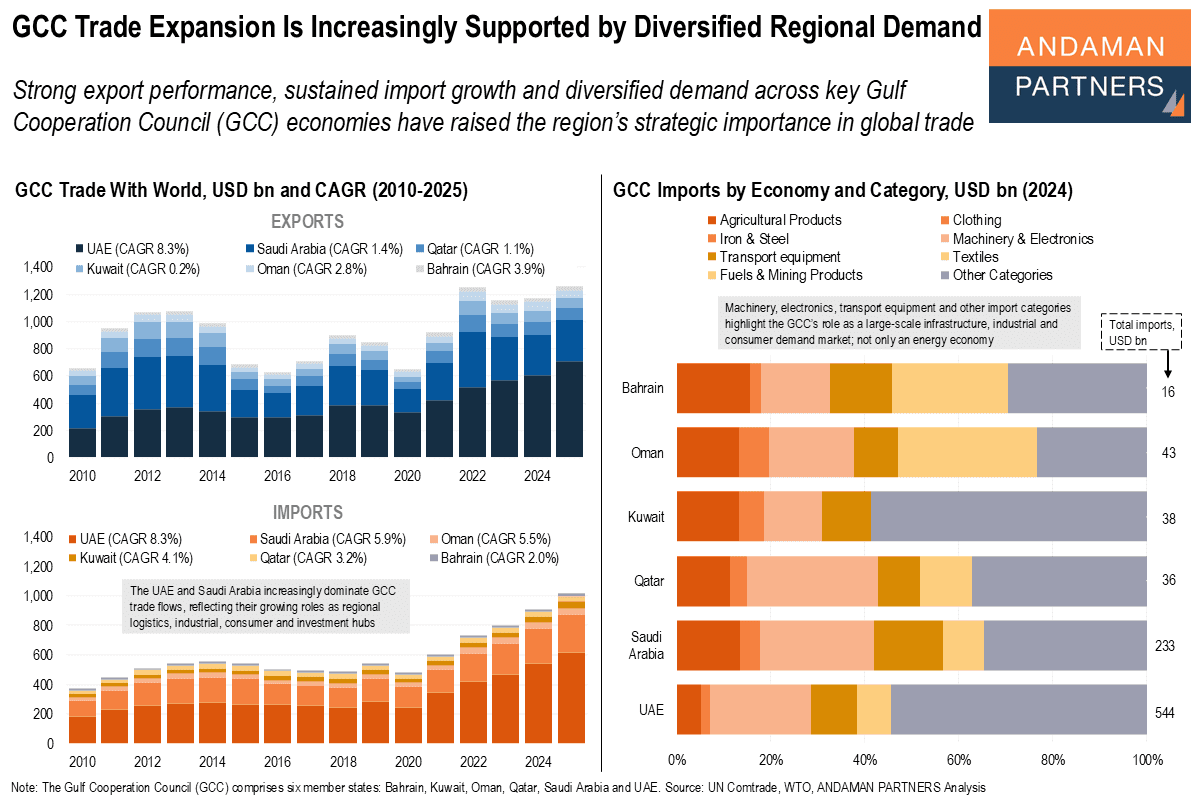
Strong export performance, sustained import growth and diversified demand across the GCC have raised the region’s strategic importance.
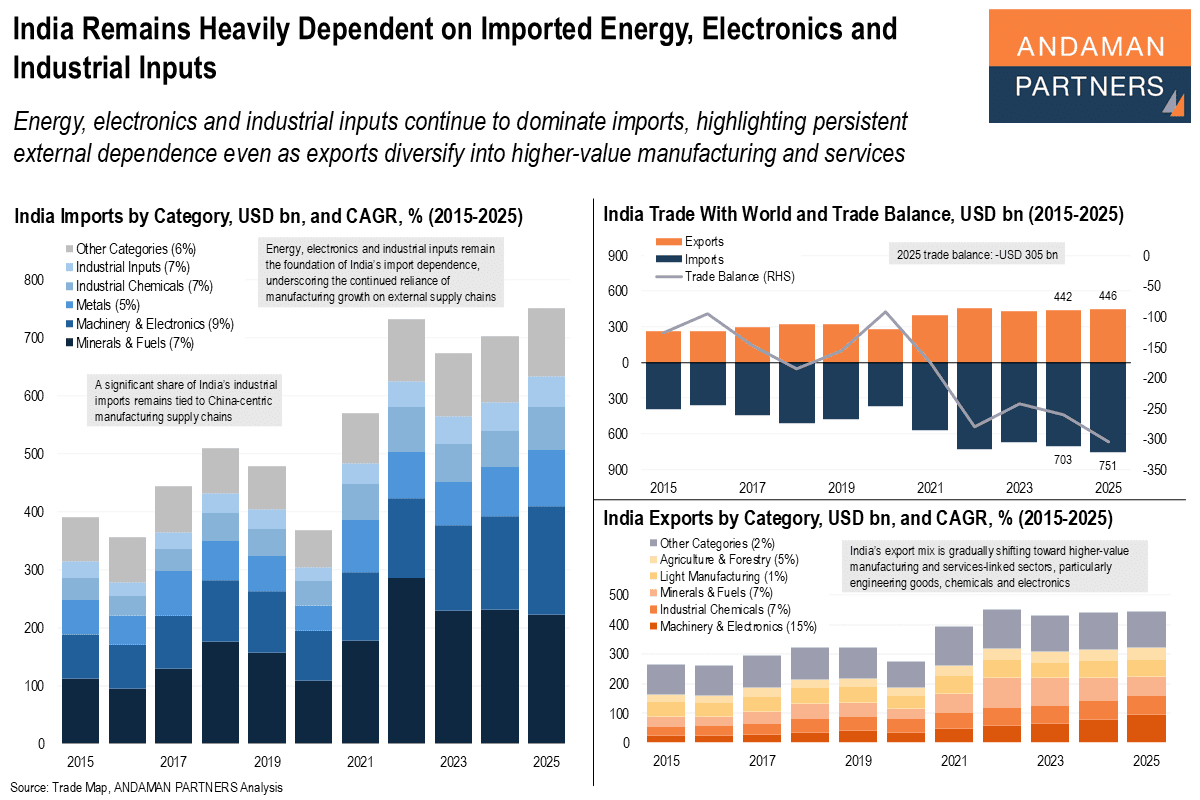
Energy, electronics and industrial inputs continue to dominate India's imports, highlighting persistent external dependence.
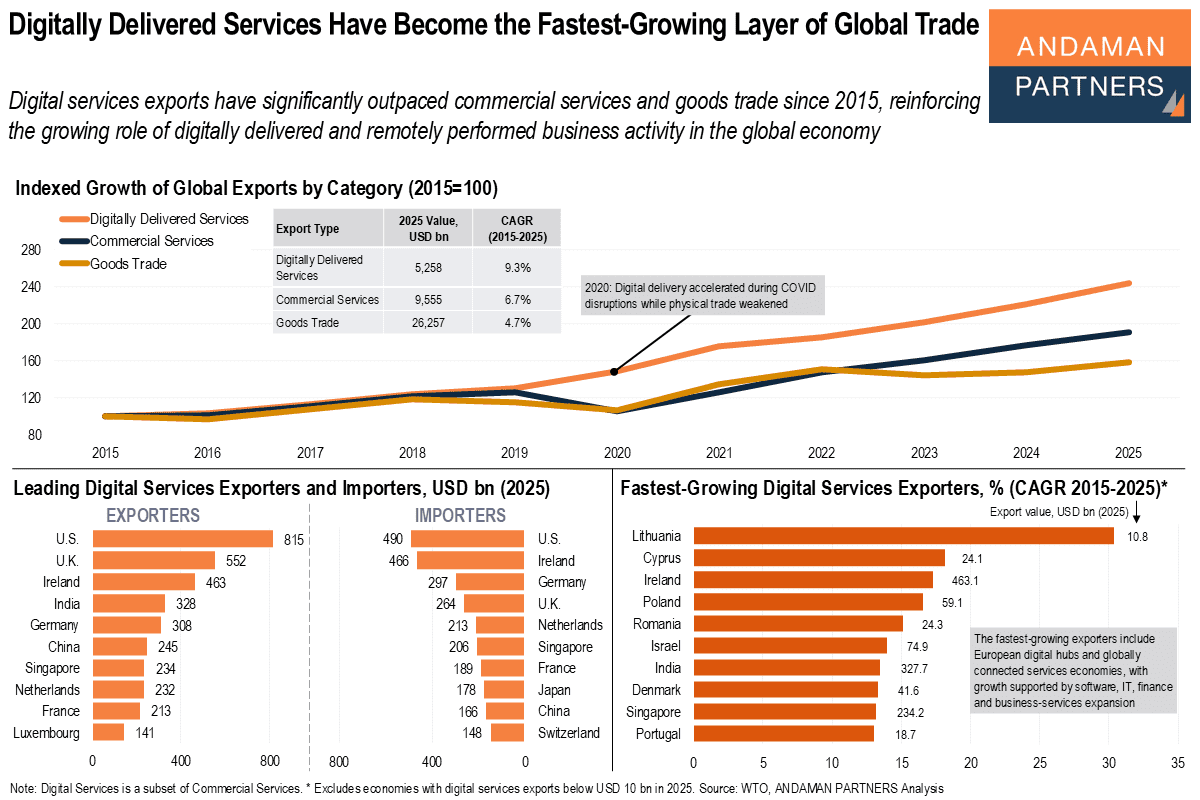
Digital services exports have significantly outpaced commercial services and goods trade since 2015.
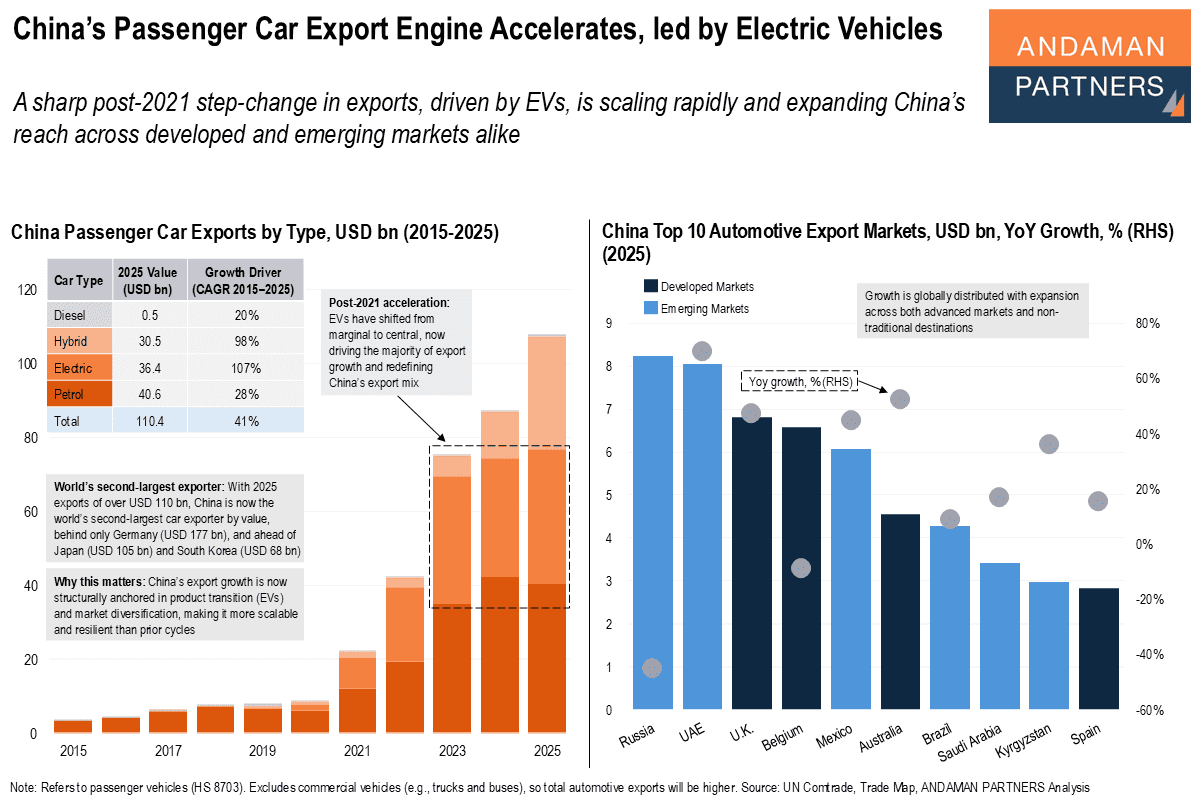
A sharp post-2021 step-change in car exports is scaling rapidly and expanding China’s reach across developed and emerging markets.
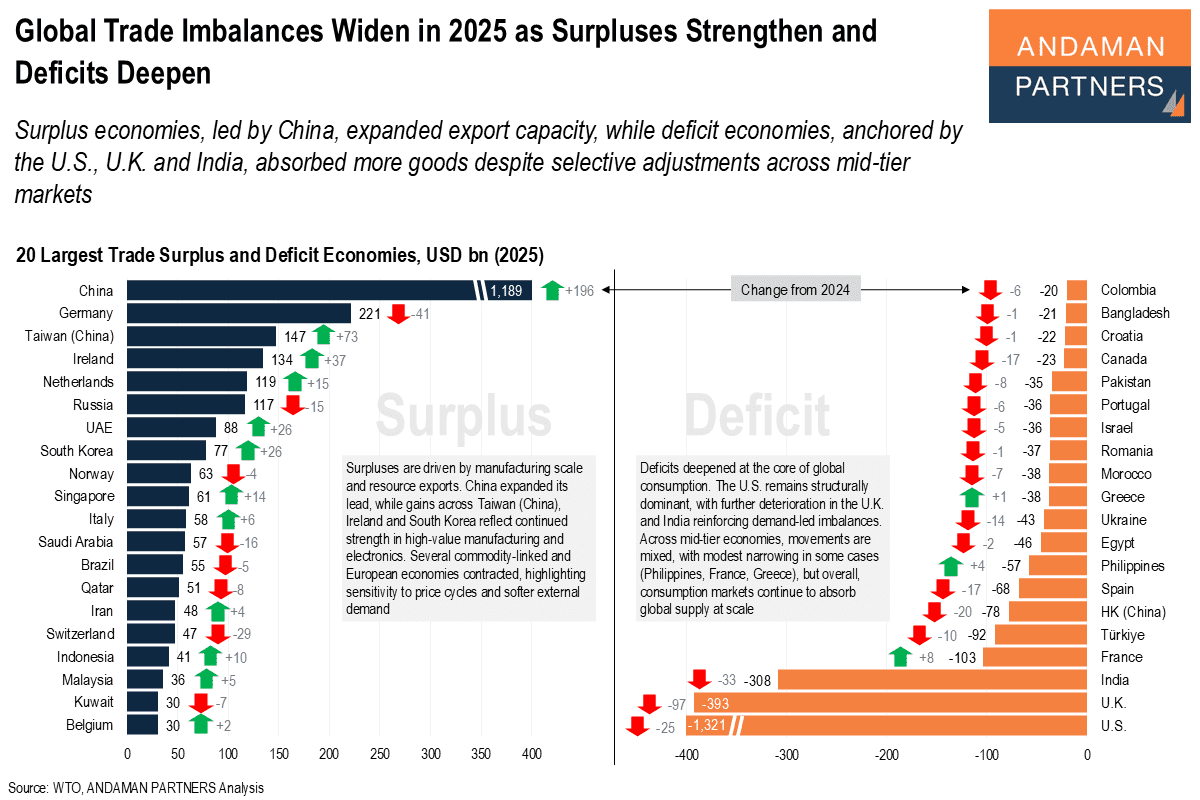
Surplus economies expanded export capacity, while deficit economies absorbed more goods despite selective adjustments across mid-tier markets.
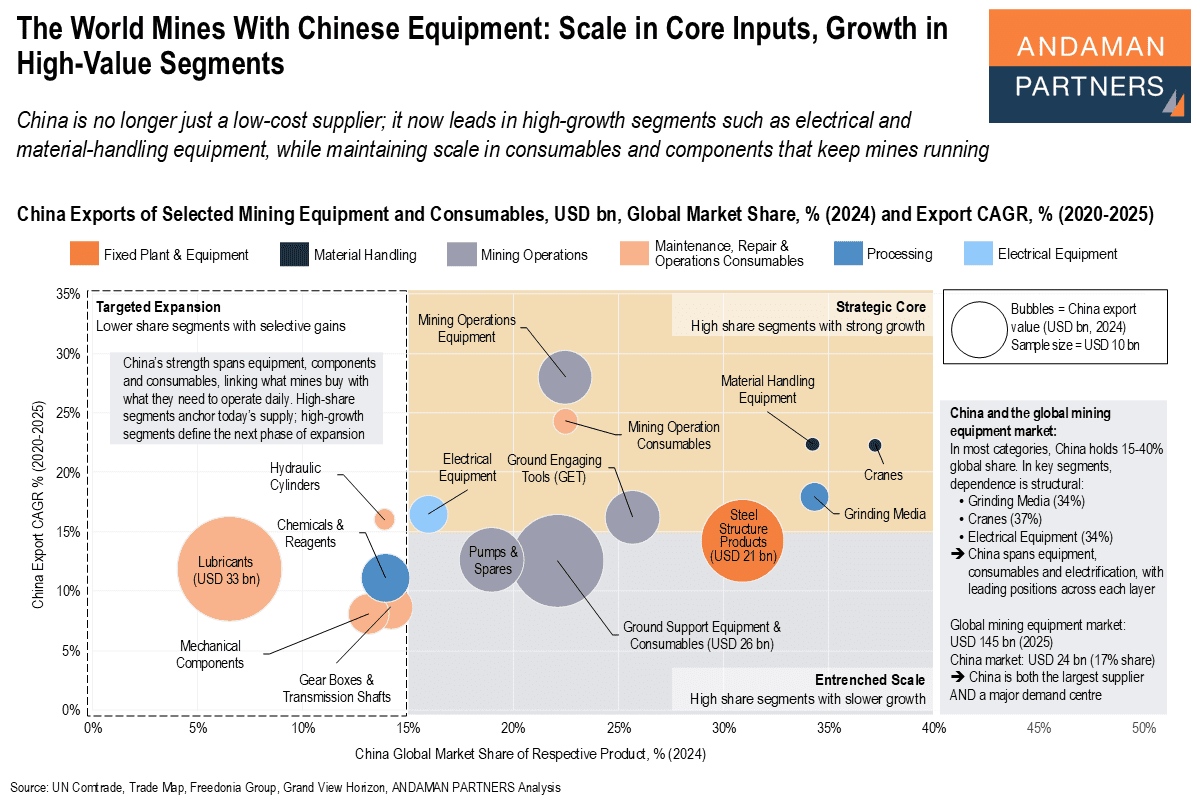
China is no longer just a low-cost supplier; it now leads in high-growth segments while maintaining scale in consumables and components.
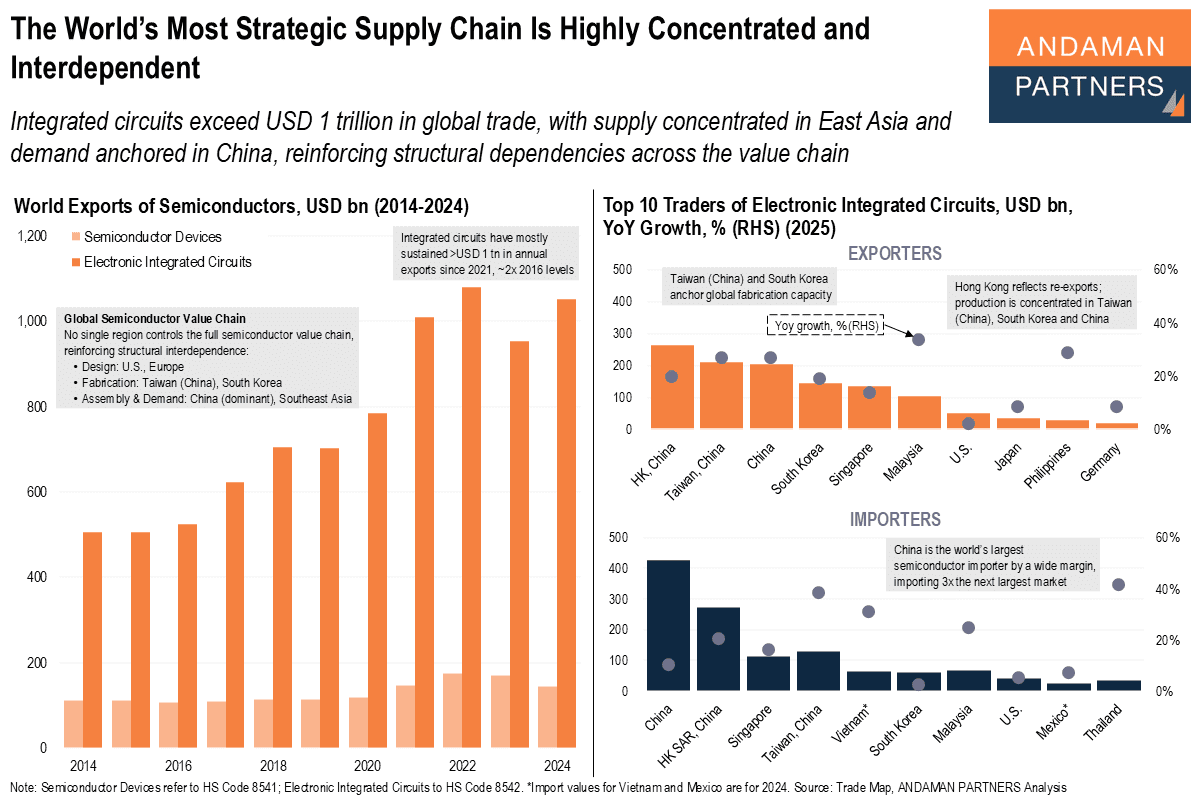
Integrated circuits exceed USD 1 trillion in global trade, with supply concentrated in Asia and demand in China, reinforcing structural dependencies.
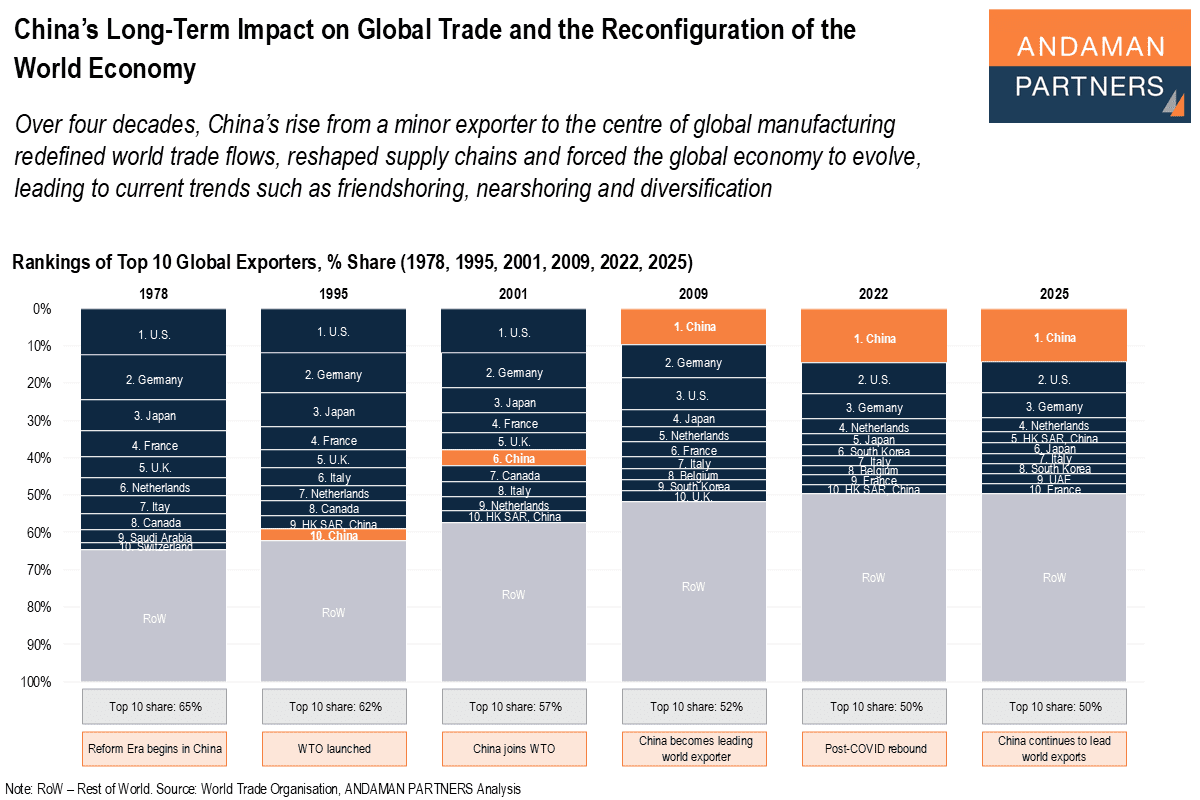
China’s rise from a minor exporter to the centre of global manufacturing redefined trade flows, reshaped supply chains and forced the global economy to evolve.