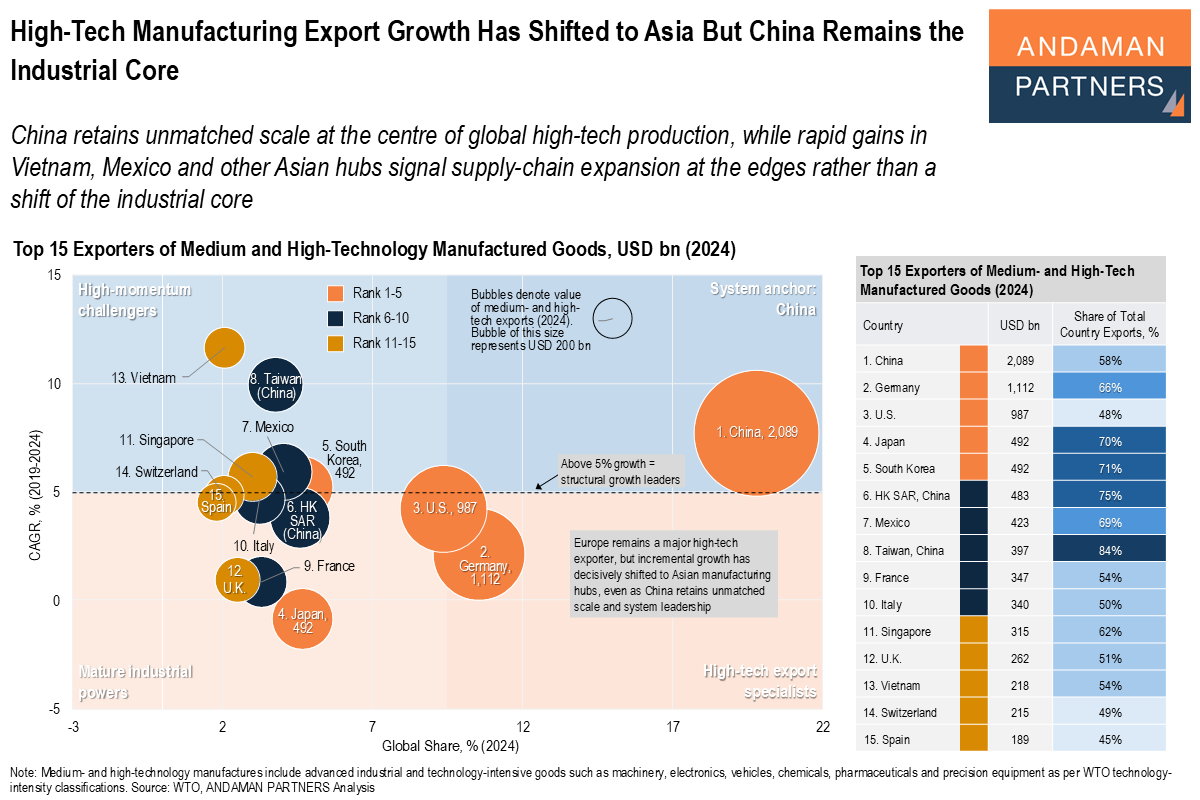
High-Tech Manufacturing Export Growth Has Shifted to Asia, But China Remains the Industrial Core
China retains unmatched scale at the centre of global high-tech production, while rapid gains in Vietnam, Mexico and other Asian hubs.

China retains unmatched scale at the centre of global high-tech production, while rapid gains in Vietnam, Mexico and other Asian hubs.
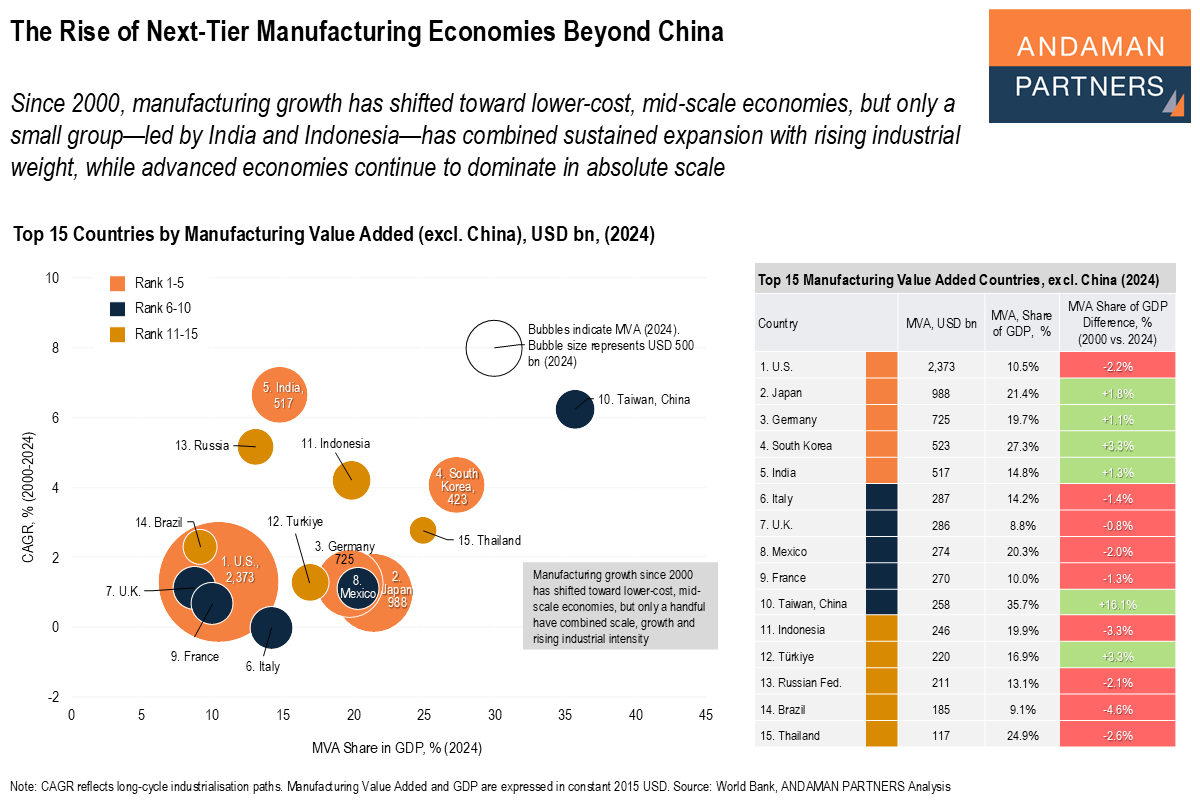
Manufacturing growth shifted toward lower-cost, mid-scale economies, but only a small group has combined sustained expansion with rising industrial weight.
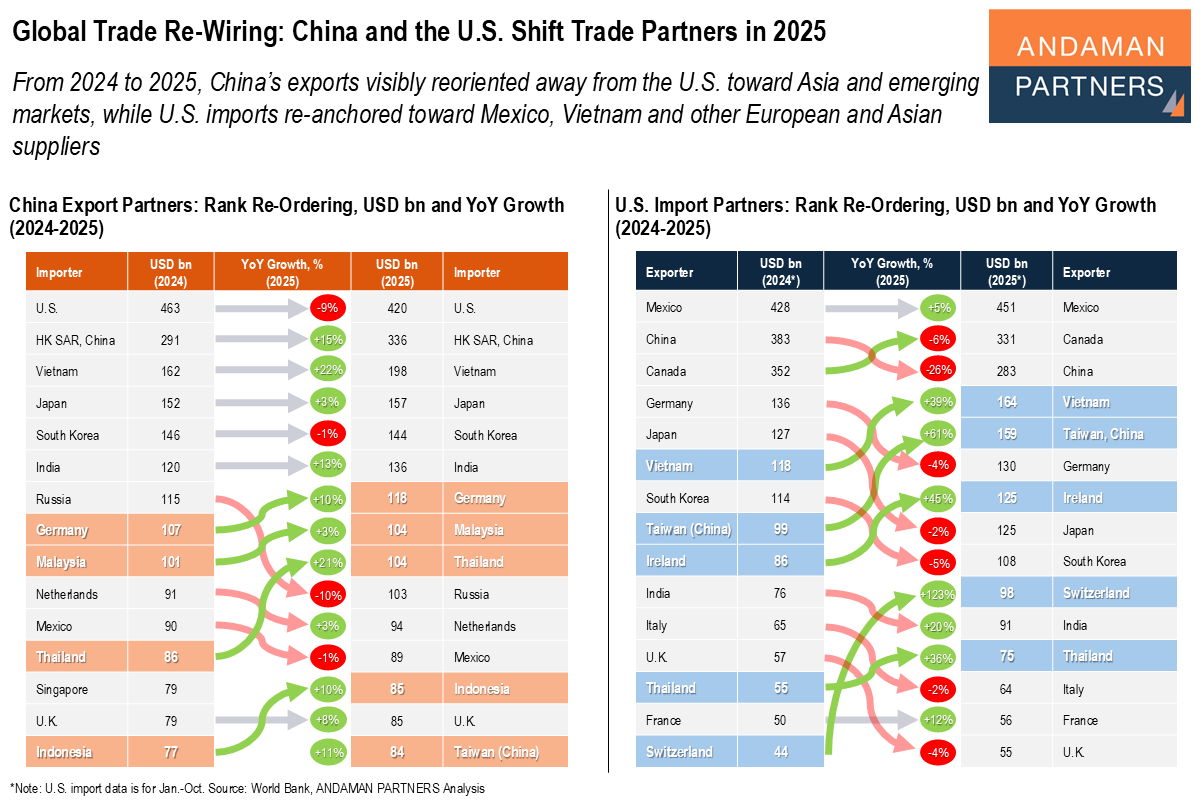
China’s exports reoriented away from the U.S. toward Asia and emerging markets, while U.S. imports re-anchored toward Mexico, Europe and Asia.
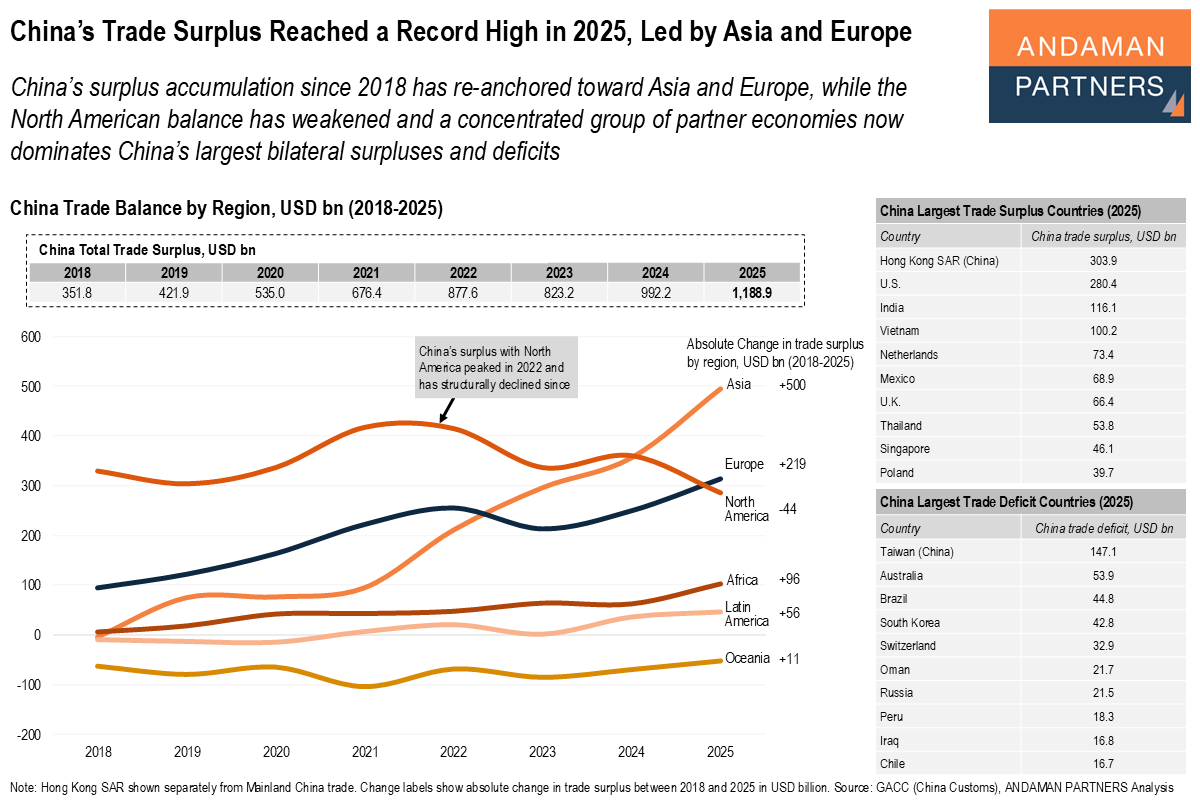
China’s surplus accumulation since 2018 has re-anchored toward Asia and Europe, while the North American balance has weakened.
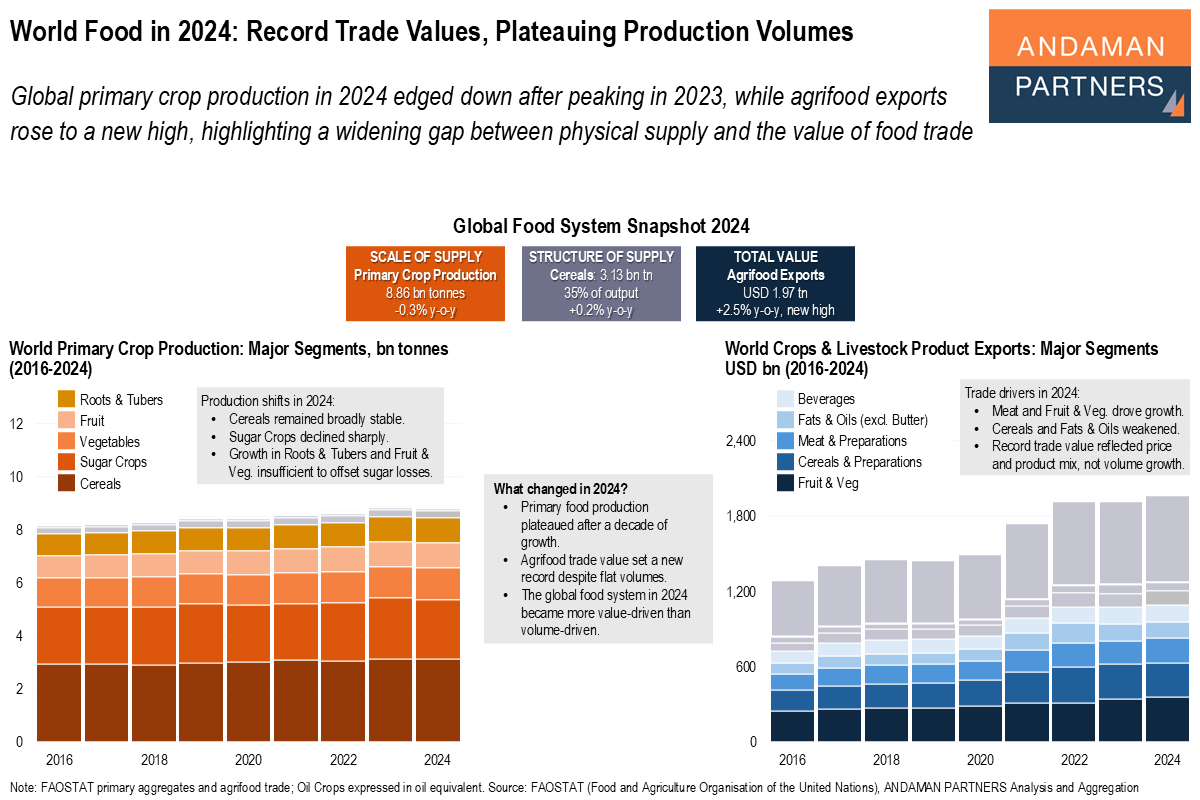
Global primary crop production in 2024 edged down after peaking in 2023, while agrifood exports rose to a new high.
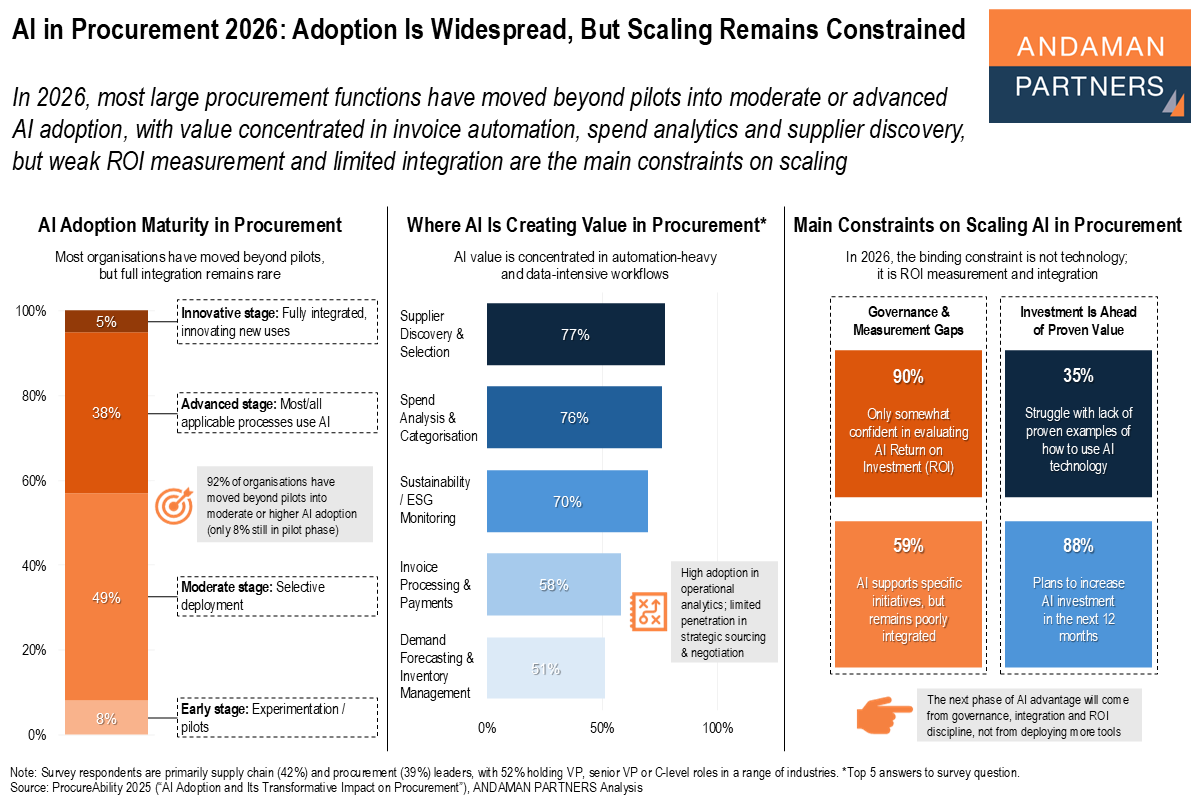
Procurement functions have moved into moderate or advanced AI adoption, but there are still constraints on scaling.
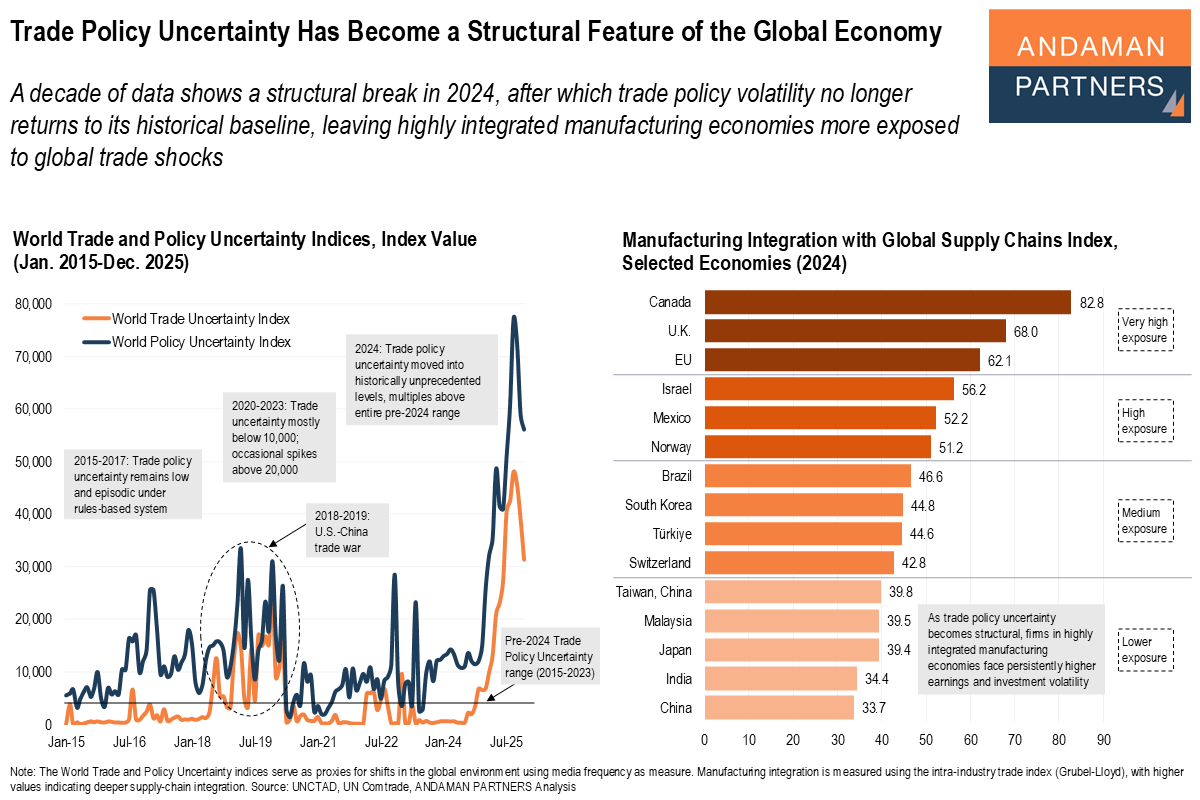
A decade of data shows a structural break in 2024, after which trade policy volatility no longer returns to its historical baseline.
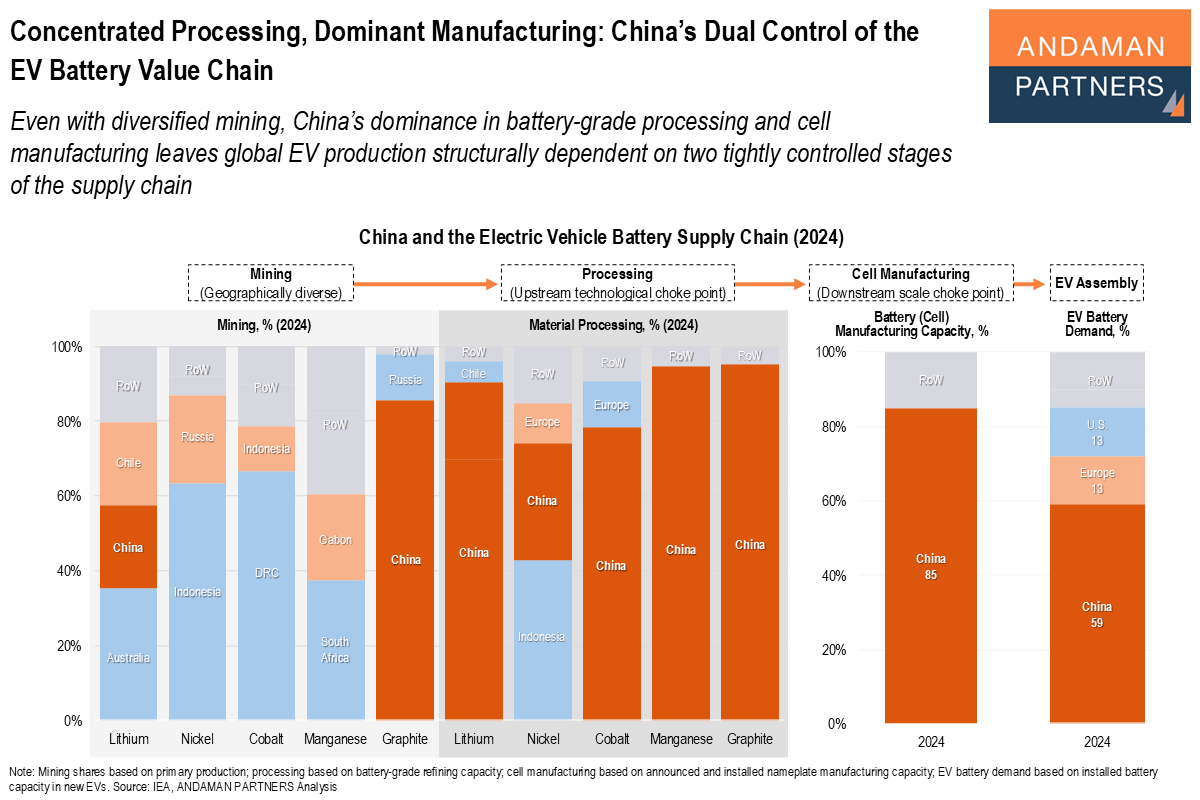
China’s dominance in battery-grade processing and cell manufacturing leaves global EV production dependent on two stages of the supply chain.
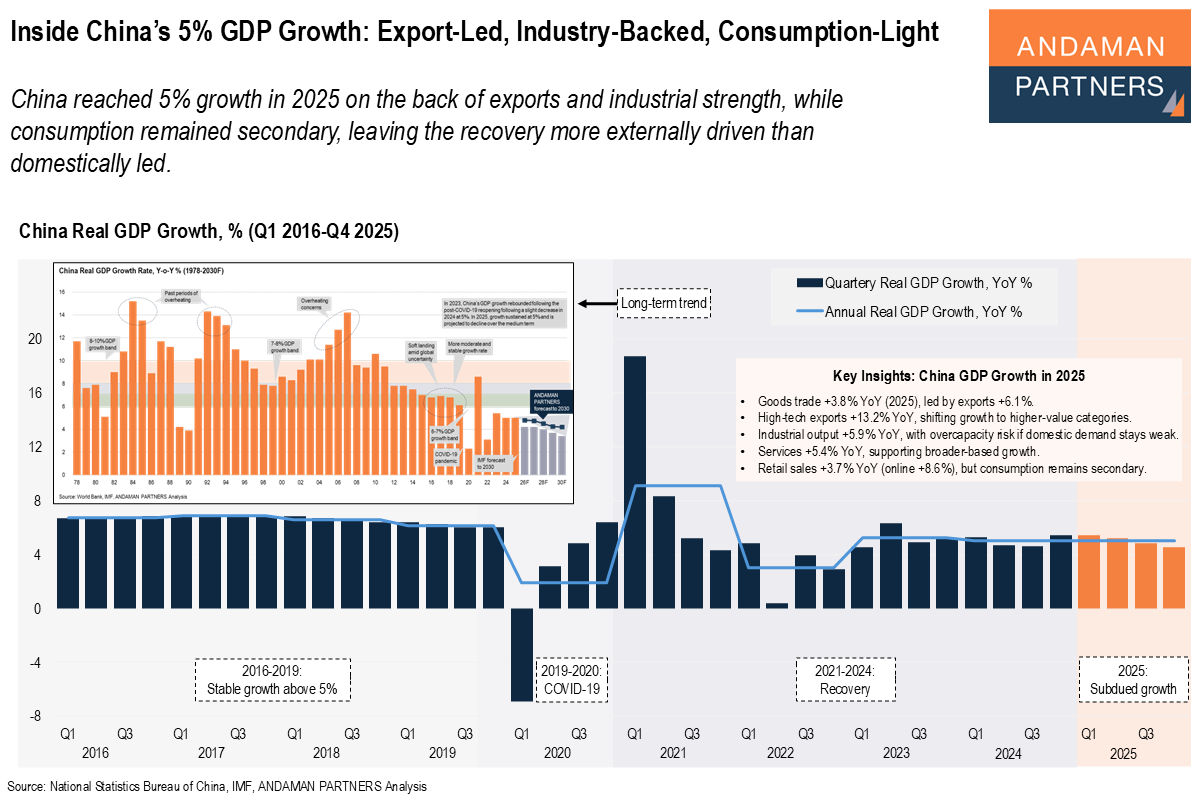
China reached 5% growth in 2025 on the back of exports and industrial strength, while consumption remained secondary.
ANDAMAN PARTNERS outlines, unpacks and unravels some of the broad shifts and finer intricacies of China’s economic development and transition in 2026.