The Global Services Power Landscape: Leaders of the World’s Fastest-Growing Trade Arena
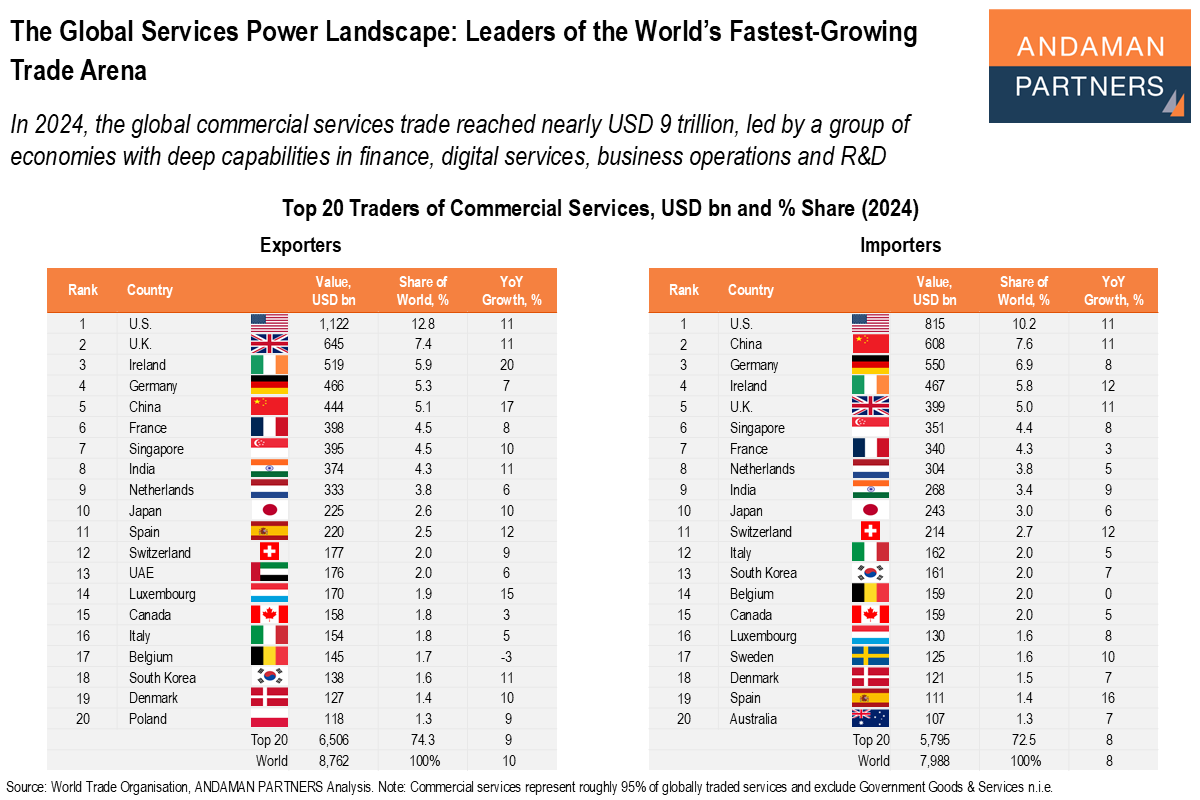
In 2024, the global commercial services trade reached nearly USD 9 trillion, led by a group of economies with deep capabilities.
In 2024, the global commercial services trade reached nearly USD 9 trillion, led by a group of economies with deep capabilities.
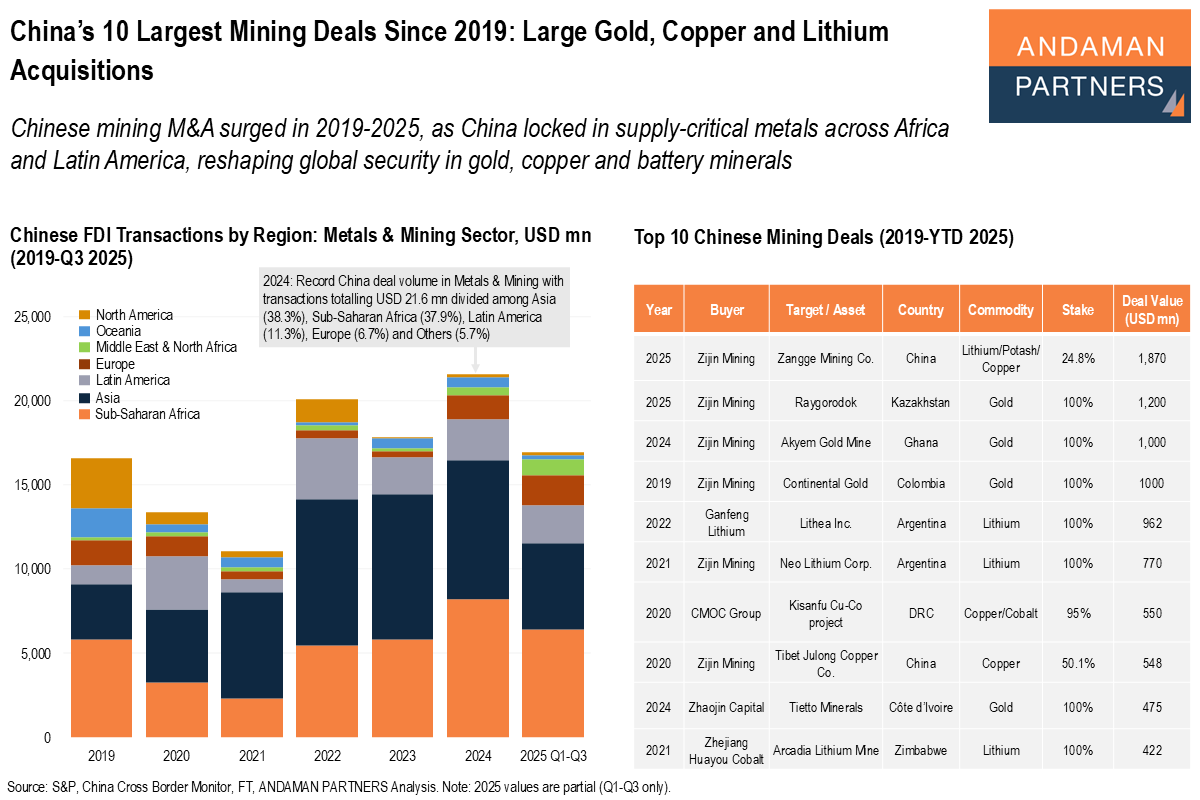
Chinese mining M&A surged in 2019-2025, as China locked in supply-critical metals across Africa and Latin America.
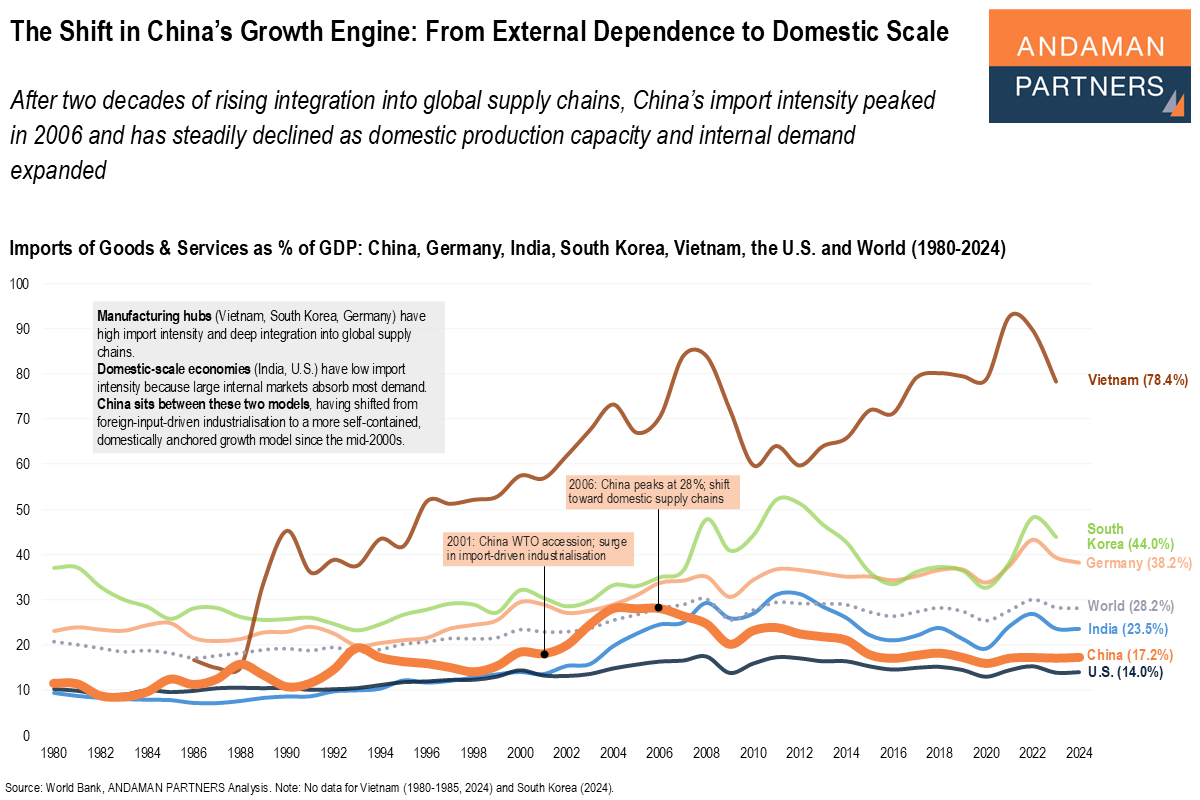
China’s import intensity peaked in 2006 and has steadily declined since then as domestic production capacity and internal demand expanded.
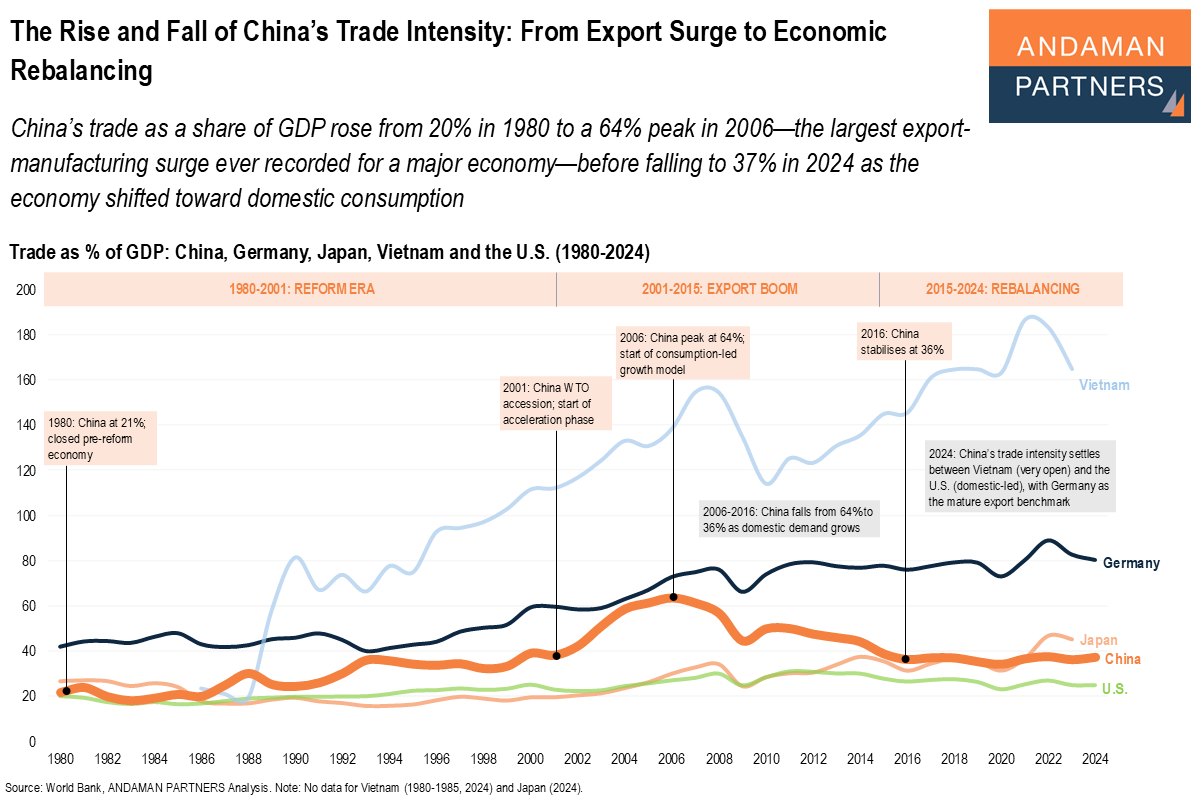
China’s trade as a share of GDP rose from 20% in 1980 to a peak of 64% in 2006 before falling to 37% in 2024 as the economy shifted toward domestic consumption.
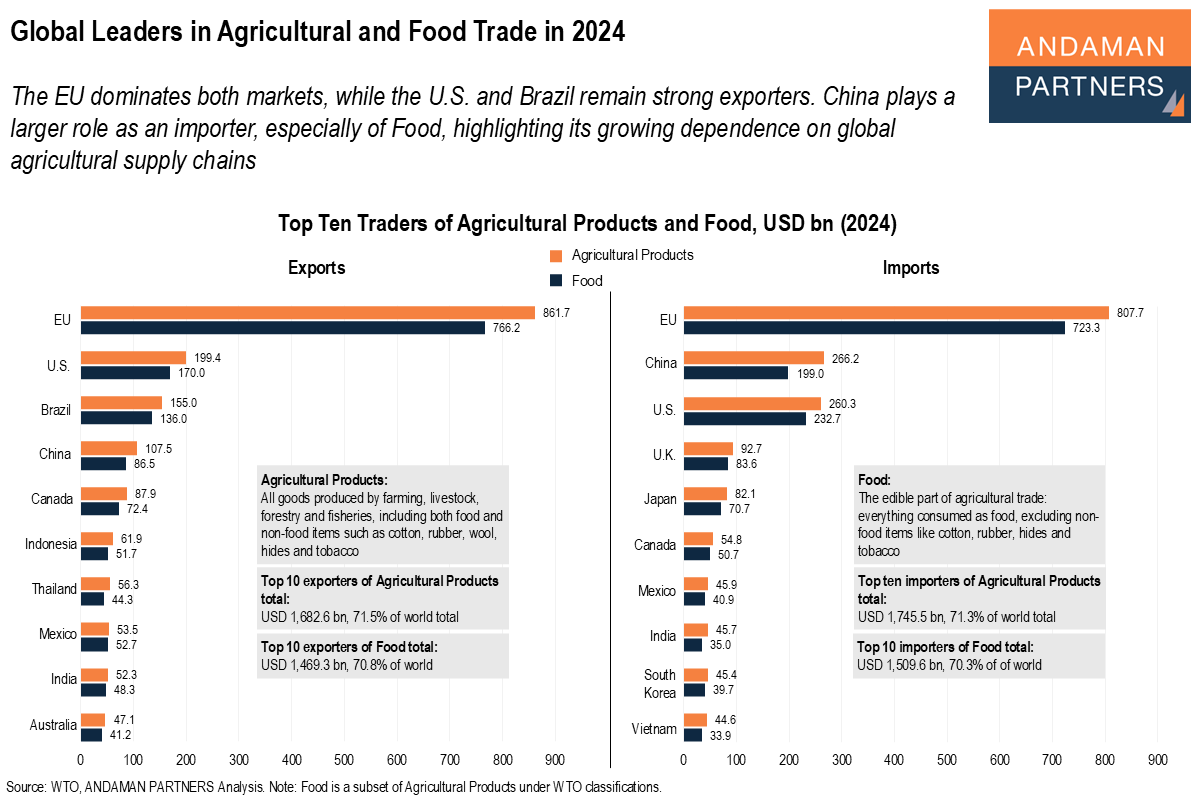
The EU dominates both markets, while the U.S. and Brazil remain strong exporters. China plays a larger role as an importer.
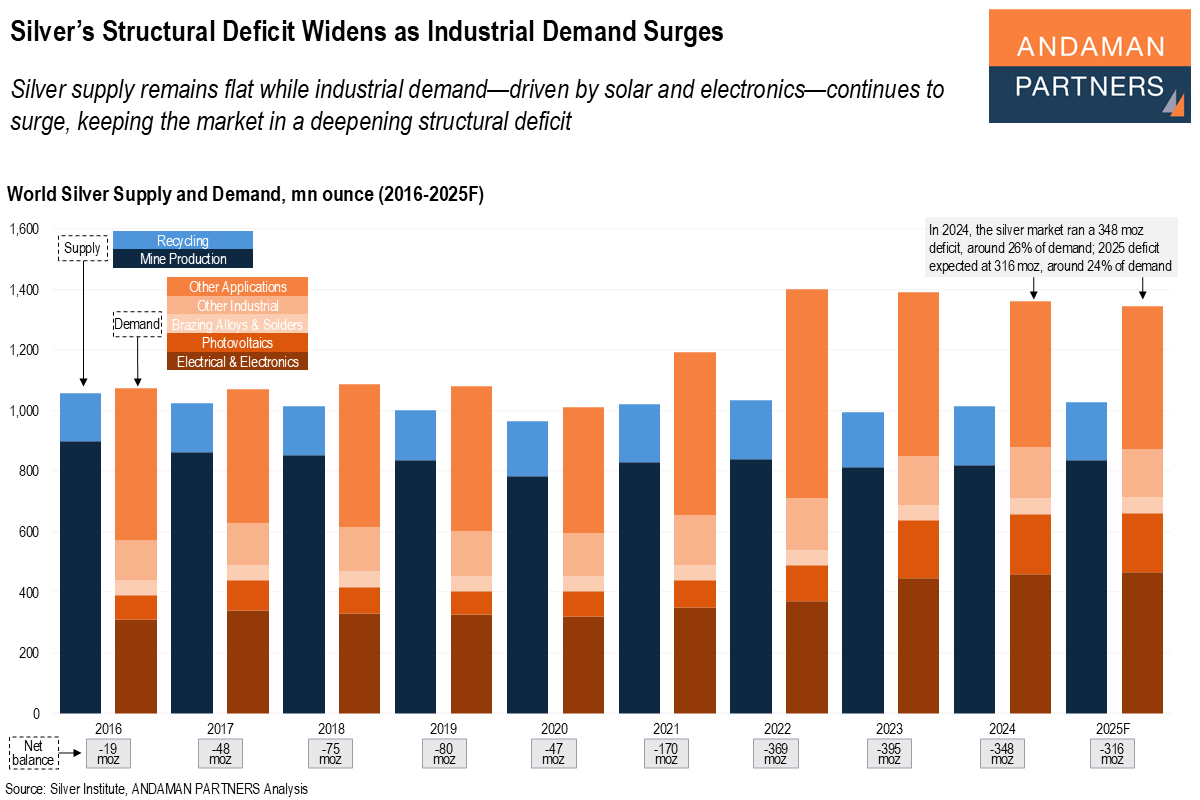
Silver supply remains flat while industrial demand—driven by solar and electronics—continues to surge, keeping the market in a deepening structural deficit.
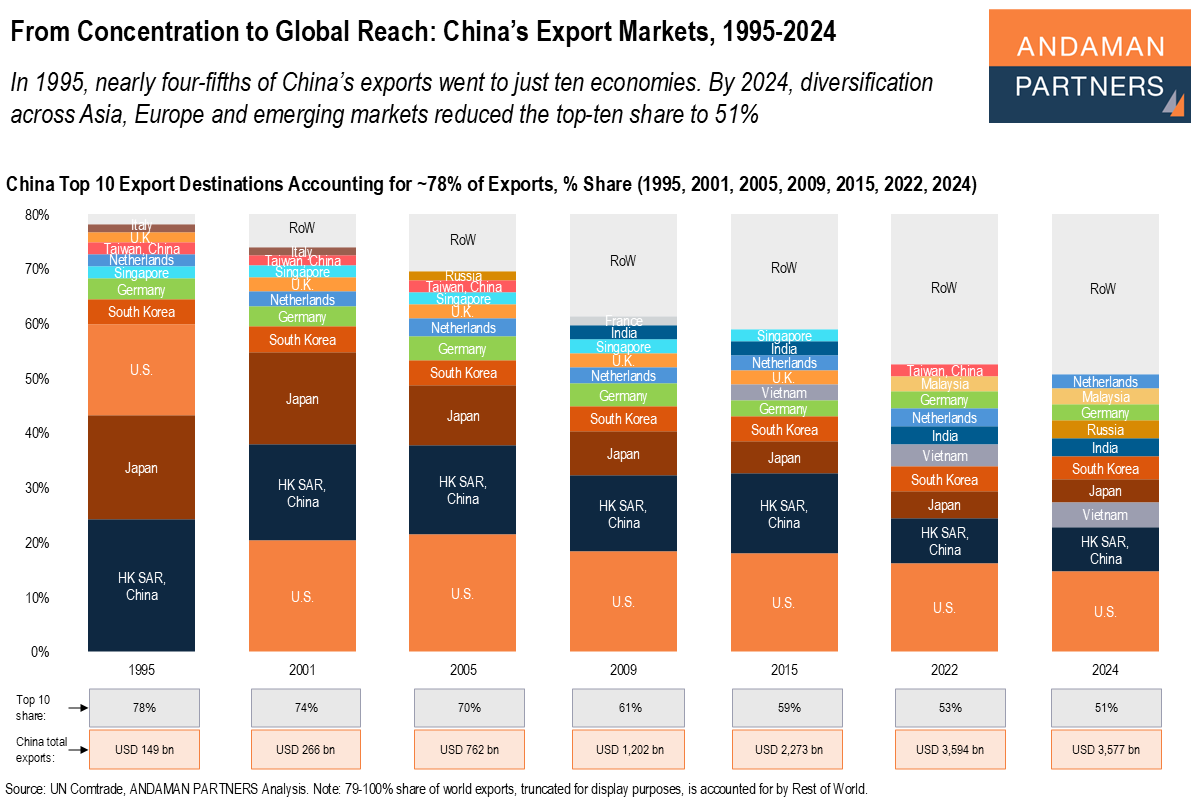
In 1995, nearly four-fifths of China’s exports went to just ten economies. By 2024, the top-ten's share was reduced to 51%.
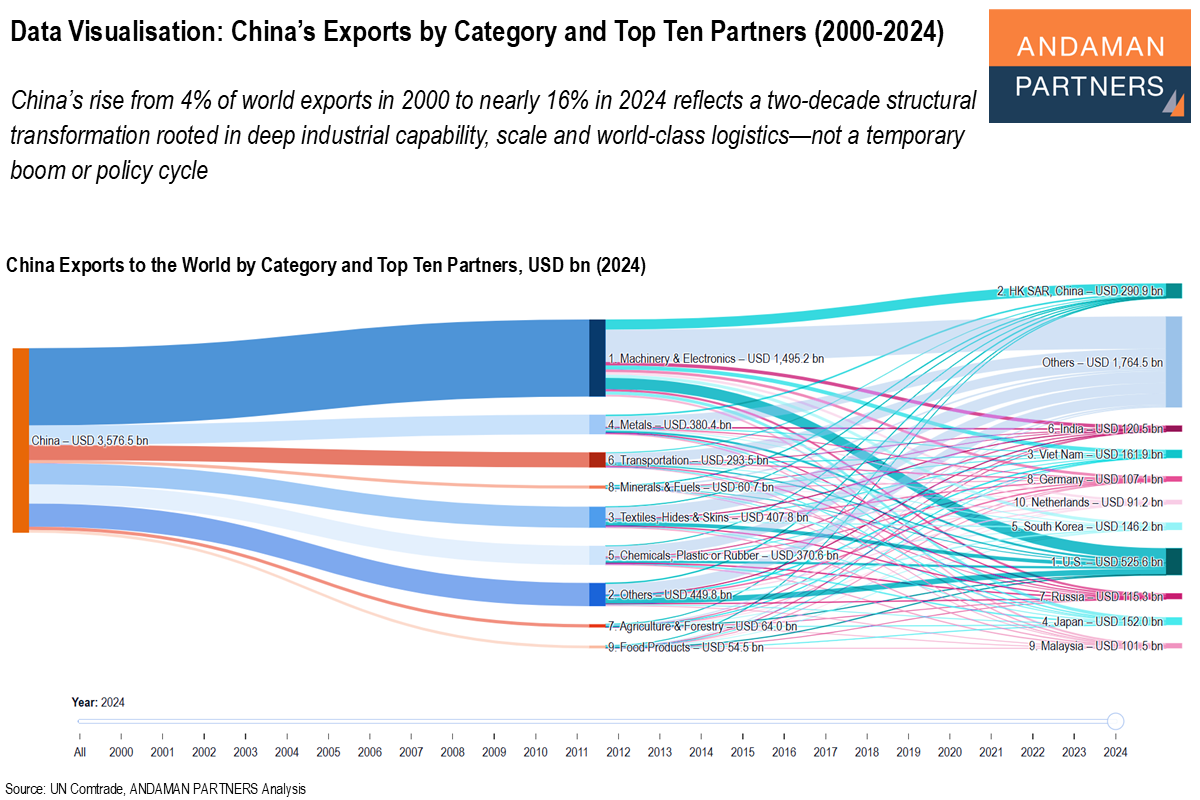
China’s rise from 4% of world exports in 2000 to nearly 16% in 2024 reflects a two-decade structural transformation.
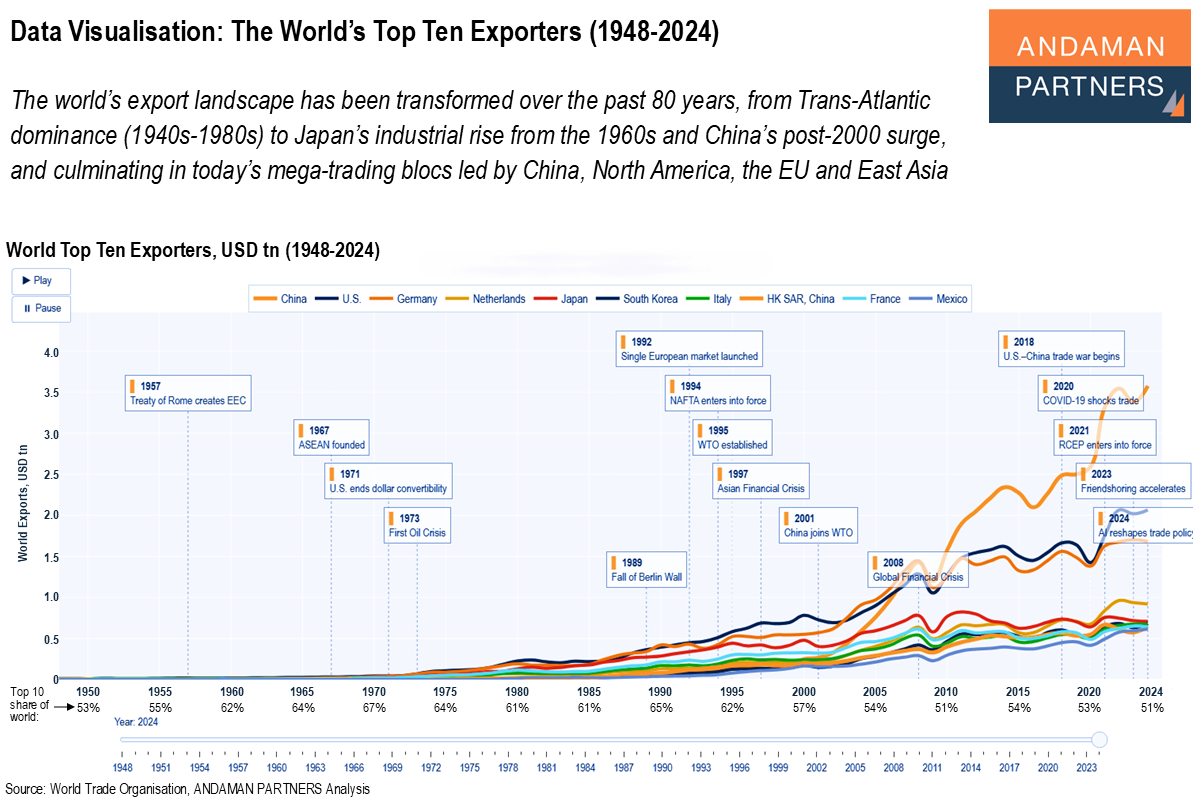
The world’s export landscape has been transformed over the past 80 years, from Trans-Atlantic dominance to Japan’s and China's rise and mega-trading blocs.
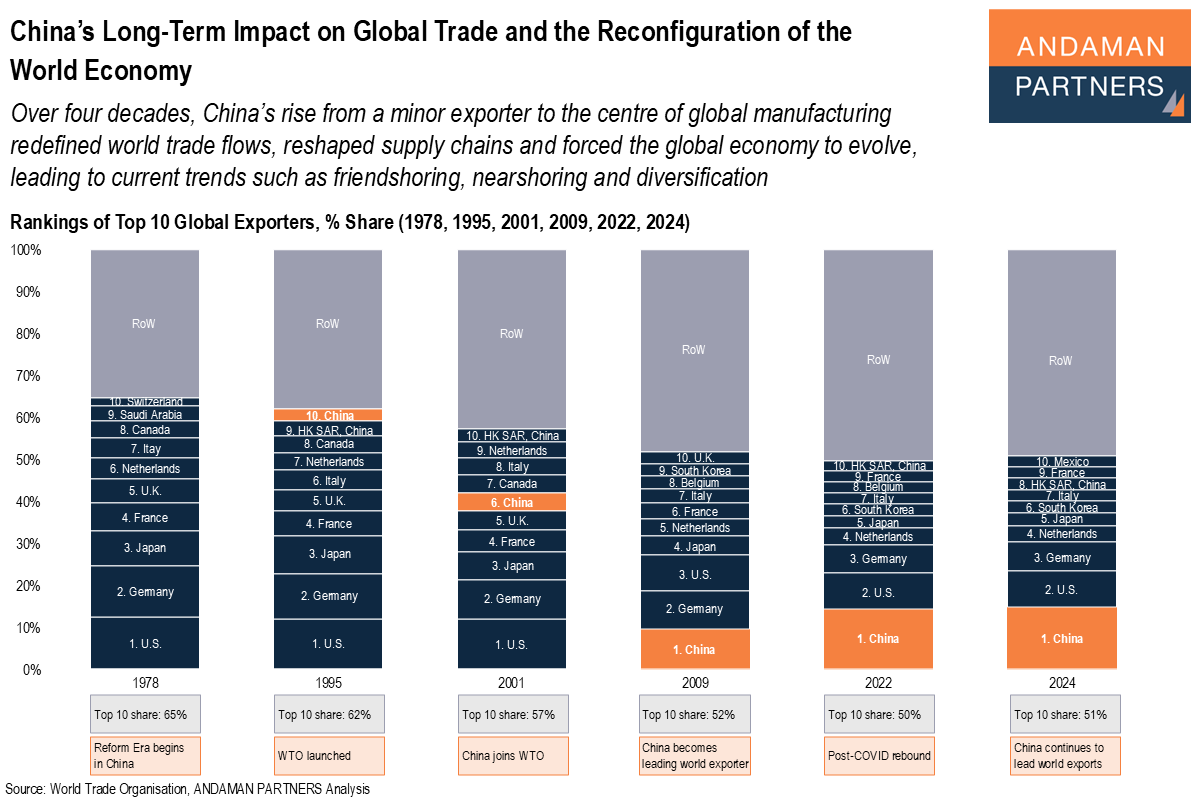
China’s rise from a minor exporter to the centre of global manufacturing redefined world trade flows, reshaped supply chains and forced the global economy to evolve.