ANDAMAN PARTNERS Attended the Australia Governance Summit 2026 in Sydney
ANDAMAN PARTNERS Co-Founder Kobus van der Wath attended the Australia Governance Summit (AGS26) in Sydney, Australia.
ANDAMAN PARTNERS Wishes You a Happy and Prosperous Year of the Horse!
Compliments of the Chinese Lunar New Year to all our clients, customers, suppliers and partners.
ANDAMAN PARTNERS to Attend Investing in African Mining Indaba 2026 in Cape Town
ANDAMAN PARTNERS Co-Founders Kobus van der Wath and Rachel Wu will attend Investing in African Mining Indaba 2026 in Cape Town, South Africa.
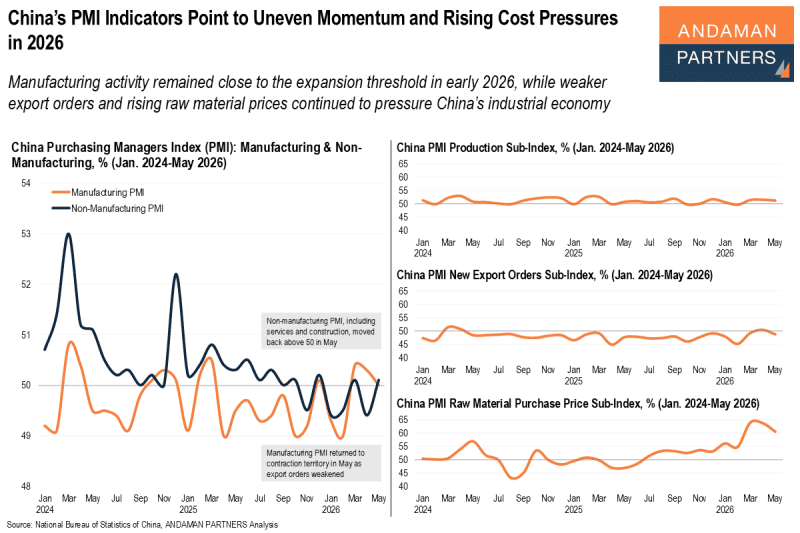
China’s PMI Indicators Point to Uneven Momentum and Rising Cost Pressures in 2026
Manufacturing activity remained close to expansion in early 2026, while weaker export orders and raw material prices pressure the economy
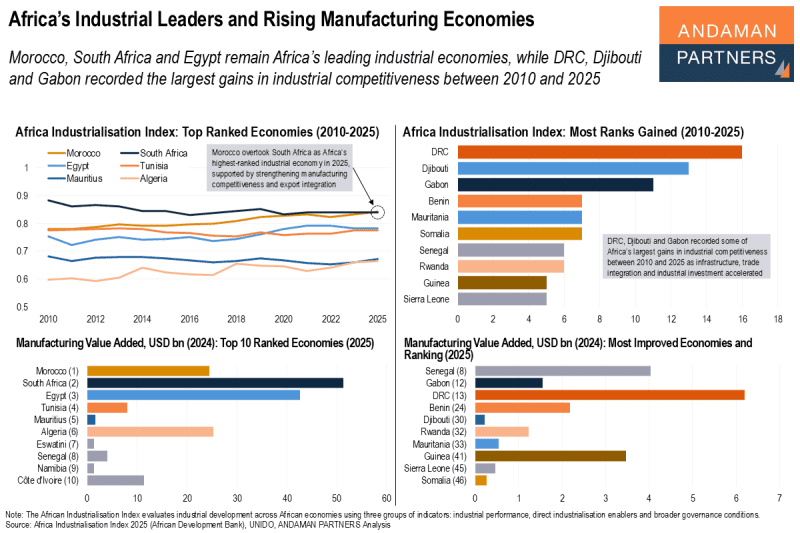
Africa’s Industrial Leaders and Rising Manufacturing Economies
Morocco, South Africa and Egypt remain Africa’s leading industrial economies; DRC, Djibouti and Gabon recorded the largest gains in competitiveness
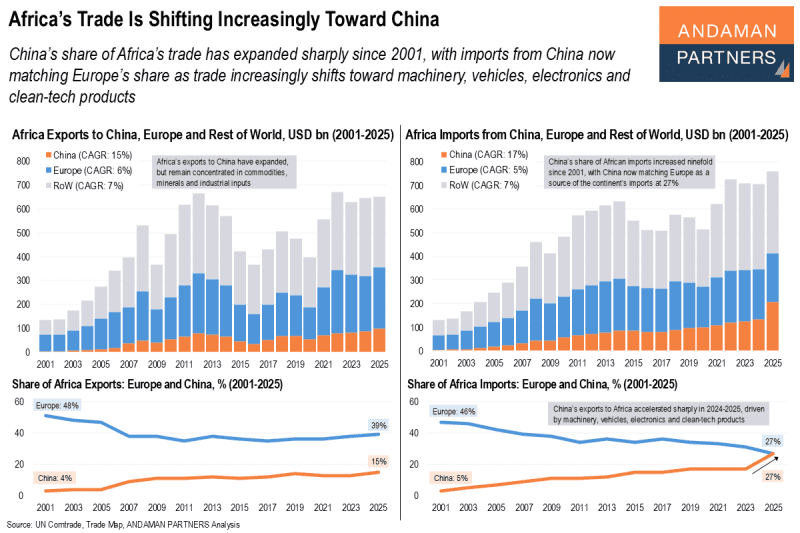
Africa’s Trade Is Shifting Increasingly Toward China
China’s share of Africa’s trade has expanded sharply since 2001, with imports from China now matching Europe’s share