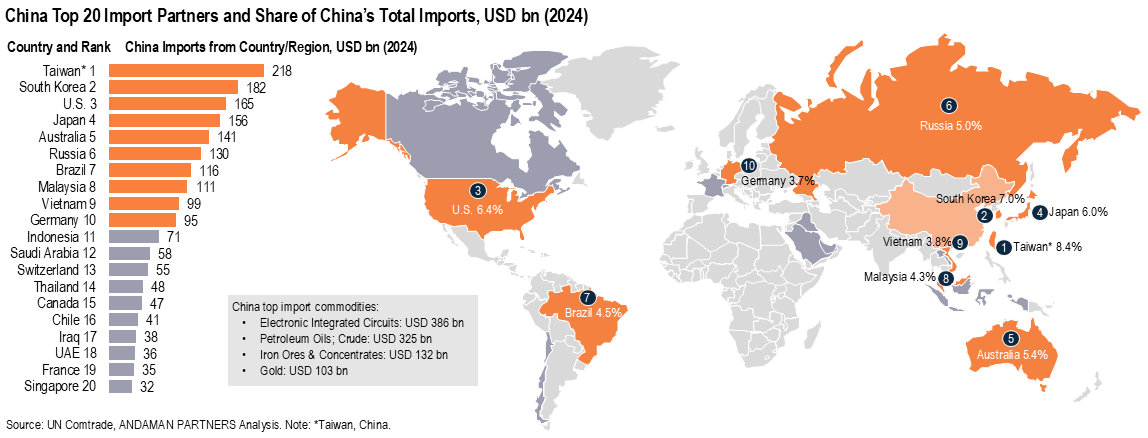

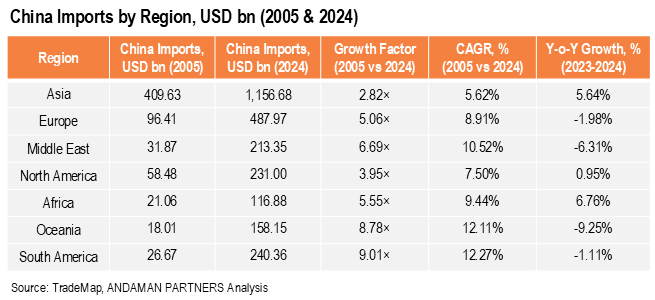
 Imports from the Middle East also proliferated, with a growth factor of 6.7 and a 10.5% CAGR. Imports from Africa grew 5.5 times with a CAGR of 9.4%. Imports from Europe and North America both had growth factors of around 4-5 times and CAGRs of 7-9%, while imports from Asia expanded the slowest, with a growth factor of 2.8 times and a CAGR of 5.6%.
ANDAMAN PARTNERS Wishes You a Happy and Prosperous Year of the Horse!
Compliments of the Chinese Lunar New Year to all our clients, customers, suppliers and partners.

ANDAMAN PARTNERS to Attend Investing in African Mining Indaba 2026 in Cape Town
ANDAMAN PARTNERS Co-Founders Kobus van der Wath and Rachel Wu will attend Investing in African Mining Indaba 2026 in Cape Town, South Africa.

Join ANDAMAN PARTNERS at Networking Event in Cape Town Ahead of Mining Indaba 2026
ANDAMAN PARTNERS is pleased to support and sponsor this popular Pre-Indaba event in Cape Town.
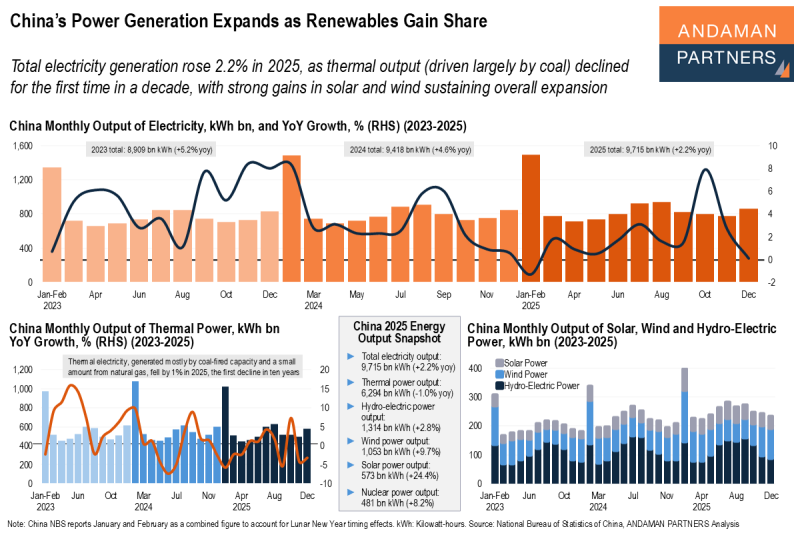
China’s Power Generation Expands as Renewables Gain Share
Electricity generation rose 2.2% in 2025, as thermal output declined for the first time in a decade, with strong gains in solar and wind.
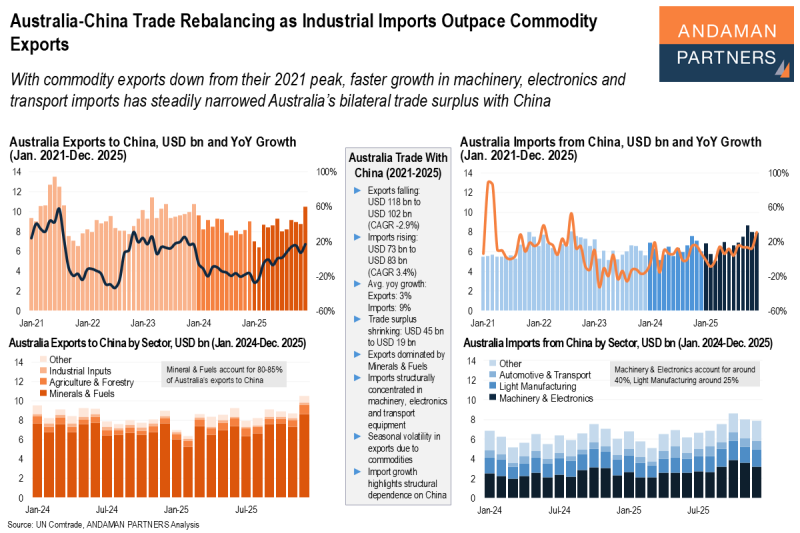
Australia-China Trade Rebalancing as Industrial Imports Outpace Commodity Exports
With commodity exports down from 2021, faster growth in machinery, electronics and transport imports has narrowed Australia’s trade surplus.
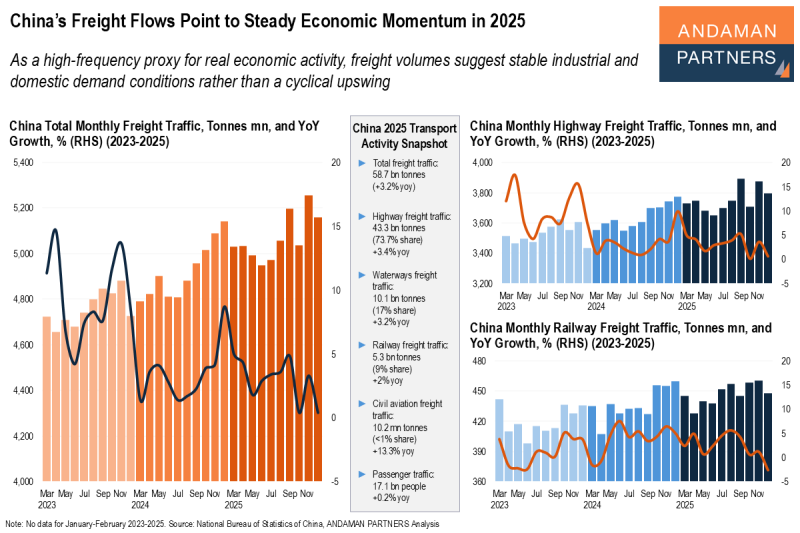
China’s Freight Flows Point to Steady Economic Momentum in 2025
Freight volumes suggest stable conditions in industrial and domestic demand rather than a cyclical upswing.