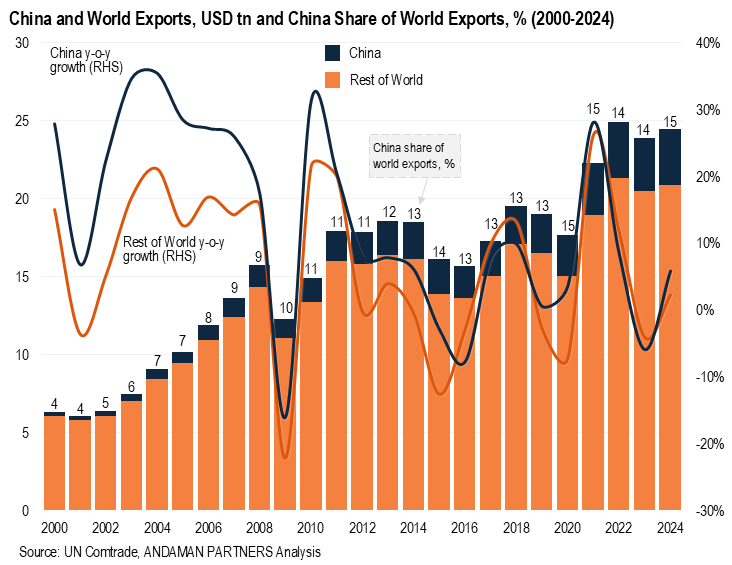
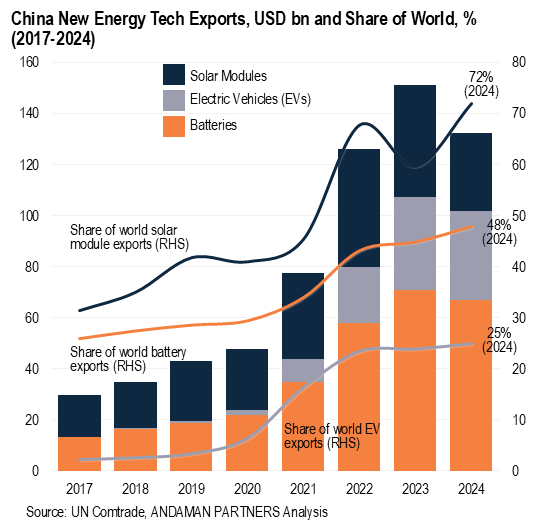
 China’s exports now also encompass the three core elements of the new energy technology revolution: Batteries, Electric Vehicles (EVs) and solar modules—and the extent of the country’s prominence in supplying the world with these products is extraordinary.
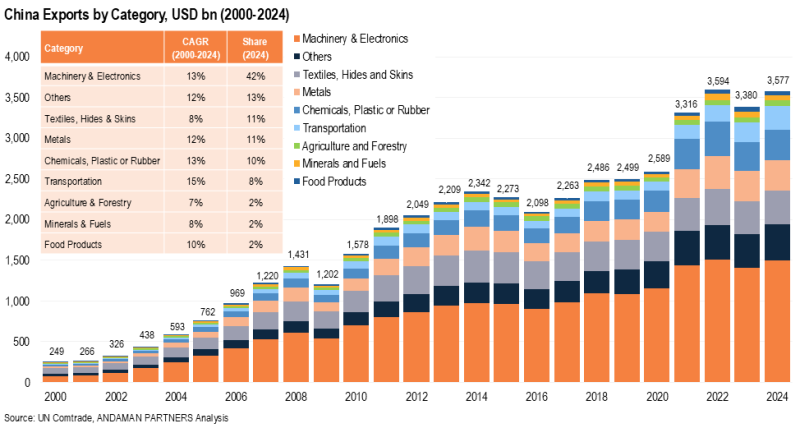
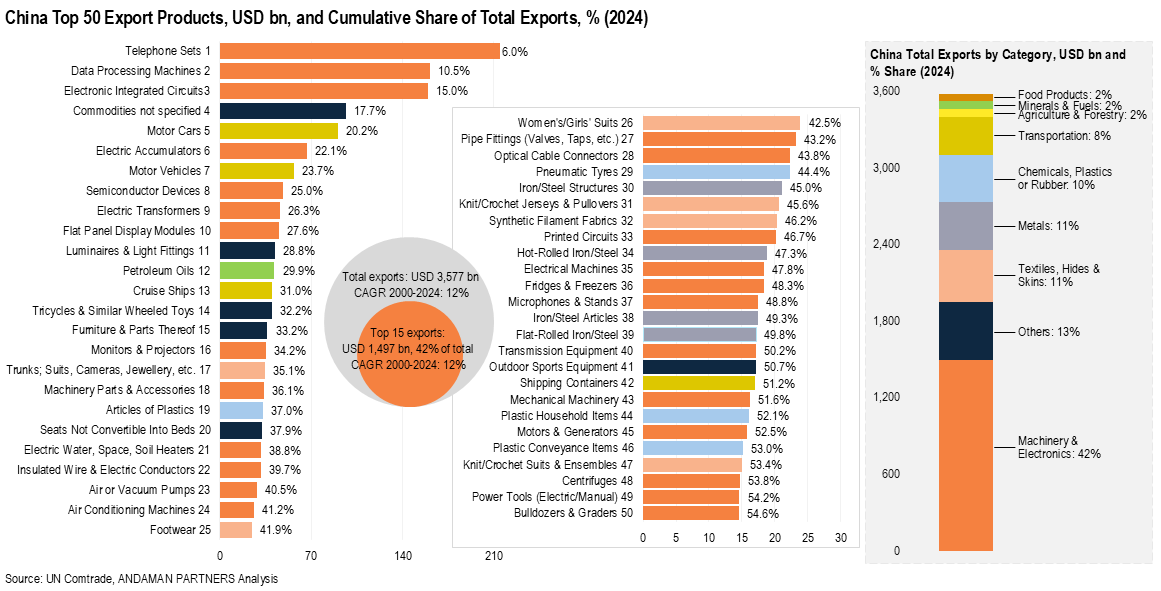
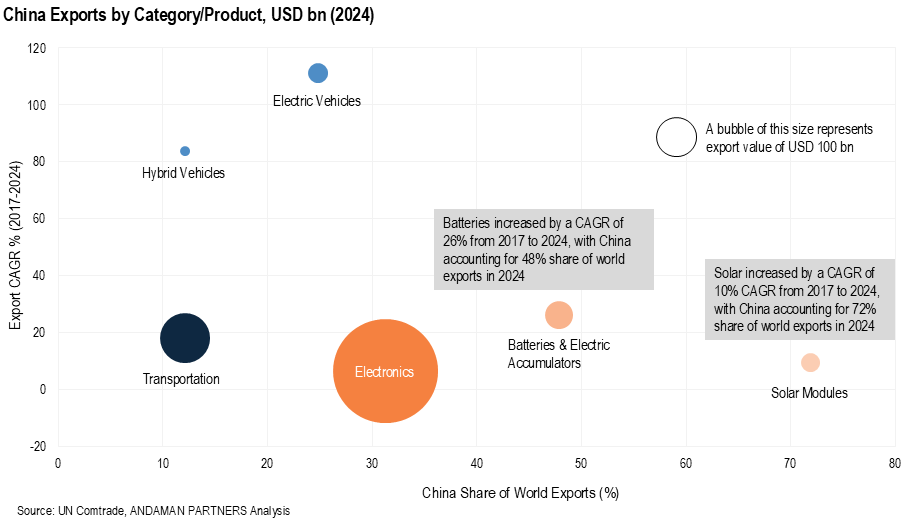
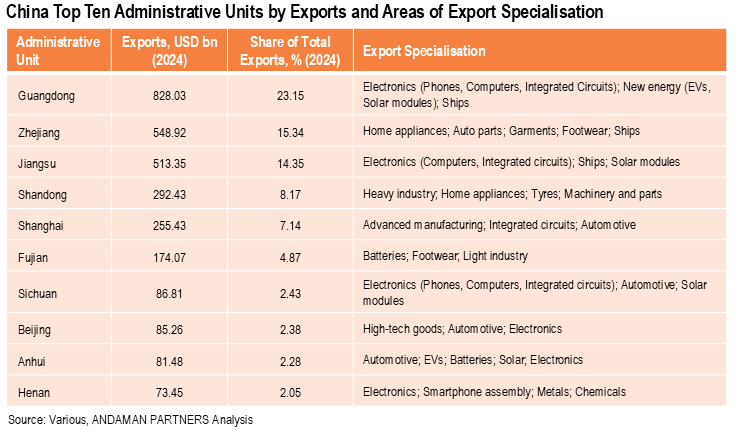
As mentioned above, in 2024, China exported batteries of USD 67 billion (the sixth-largest export product overall). In the same year, China exported EVs of USD 34.62 billion and solar modules of USD 30.60 billion.
From 2017 to 2024, China’s battery exports increased by a CAGR of 26%, solar module exports increased by 9.3%, and EV exports increased by 111%. In 2024, China accounted for 25% of the world’s EV exports, up from barely 2% in 2017; 48% of the world’s battery exports, a share that almost doubled from 2017; and 72% of the world’s solar module exports, up from 31% in 2017.
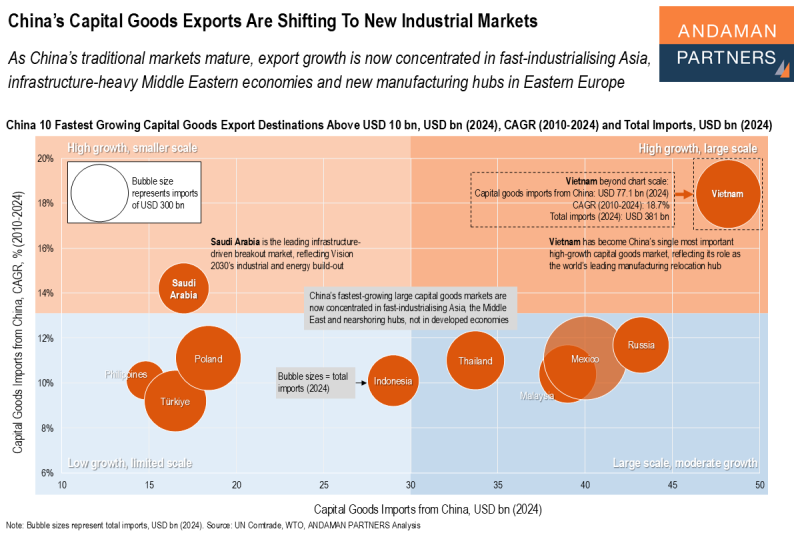
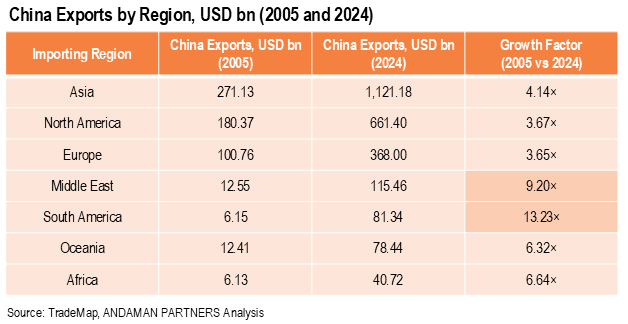 On a regional basis, from 2005 to 2024, China’s exports to the Middle East expanded by more than nine times, and to South America by more than 13 times, although in both cases from a relatively low base. China’s exports to these regions grew considerably faster than shipments to Africa and Oceania. China’s substantially larger exports to Asia, North America and Europe expanded by much lower growth rates over this period.
Initial trends in 2025 suggest that China is re-routing more exports toward Africa, Latin America, the Middle East and Southeast Asia. Preliminary 2025 data indicate strong China export growth to Africa (+21.6% year-on-year) and steady flows to Latin America, while exports to Europe, North America and Oceania have contracted sharply. Chinese exports to Africa surged in the first half of 2025, especially in a few leading importing markets such as Nigeria, Côte d’Ivoire, Guinea and Angola.

ANDAMAN PARTNERS Attended the Australia Governance Summit 2026 in Sydney
ANDAMAN PARTNERS Co-Founder Kobus van der Wath attended the Australia Governance Summit (AGS26) in Sydney, Australia.
ANDAMAN PARTNERS Wishes You a Happy and Prosperous Year of the Horse!
Compliments of the Chinese Lunar New Year to all our clients, customers, suppliers and partners.

ANDAMAN PARTNERS to Attend Investing in African Mining Indaba 2026 in Cape Town
ANDAMAN PARTNERS Co-Founders Kobus van der Wath and Rachel Wu will attend Investing in African Mining Indaba 2026 in Cape Town, South Africa.
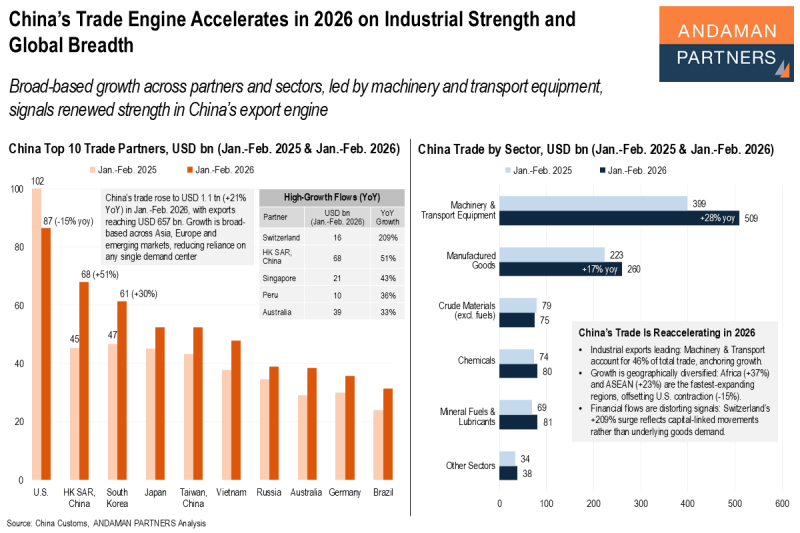
China’s Trade Engine Accelerates in 2026 on Industrial Strength and Global Breadth
Broad-based growth across partners and sectors, led by machinery and transport equipment, signals renewed strength in China’s export engine.
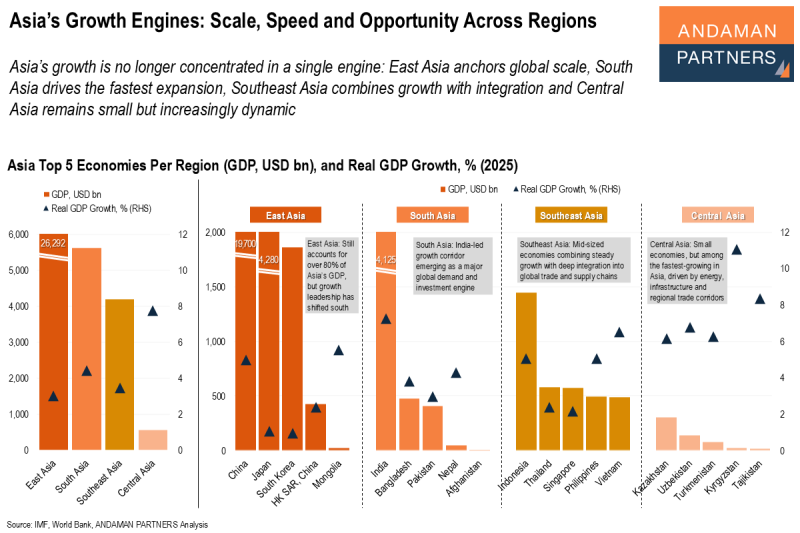
Asia’s Growth Engines: Scale, Speed and Opportunity Across Regions
Asia’s scale, speed and integration are no longer concentrated in a single core, but spread across multiple, complementary engines.
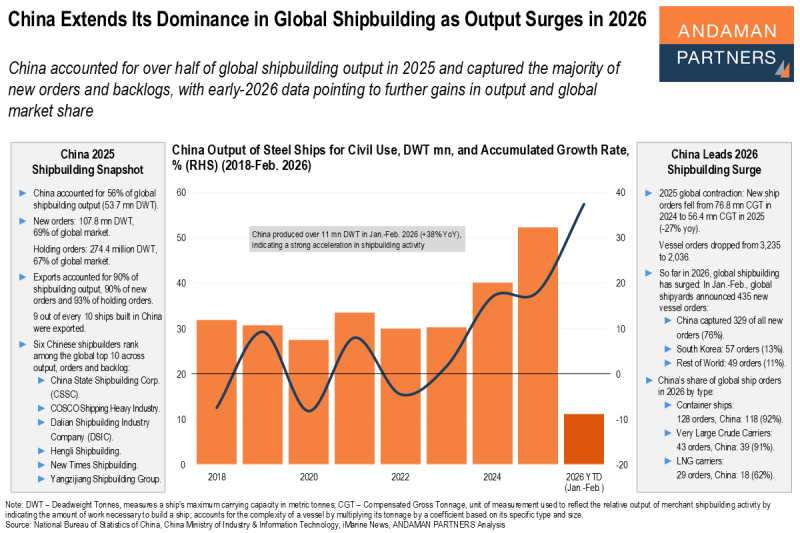
China Extends Its Dominance in Global Shipbuilding as Output Surges in 2026
Even as global ship orders declined in 2025, early-2026 data shows a rapid rebound, with China securing the vast majority of new contracts.