

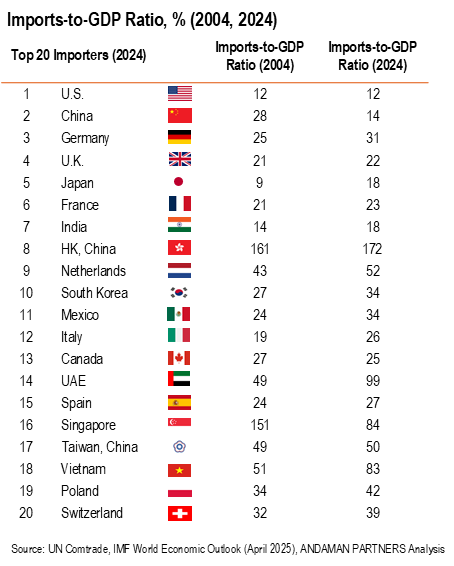
Other countries with high imports-to-GDP ratios in 2024 were the UAE (99%), Vietnam (83%), the Netherlands (52%), Taiwan, China (50%) and Poland (42%).
Aside from Hong Kong (China), countries with notable increases in imports-to-GDP ratios over this period were Germany, Japan, India, the Netherlands, South Korea, Mexico, Italy, the UAE, Vietnam, Poland and Switzerland.
Countries with the lowest imports-to-GDP ratios in 2024 were the U.S. (12%), China (14%), Japan (18%) and India (18%).
The U.S. ratio remained unchanged from 2004 to 2024, while China’s decreased from 28% to 14%. Canada and Singapore also had decreasing ratios over this period.


ANDAMAN PARTNERS Was a Co-Sponsor of the South African National Day Reception in Shanghai on 30 May 2025
ANDAMAN PARTNERS was a cosponsor of the South African National Day Reception in Shanghai on 30 May 2025.

Asia’s Shifting Role in Global Supply Chains — Perspectives by ANDAMAN PARTNERS Co-Founder Rachel Wu
Analysis by ANDAMAN PARTNERS Co-Founder Rachel Wu on changing patterns in global supply chains.

ANDAMAN PARTNERS Co-sponsored the West Australian Mining Club Luncheon in Perth on 27 February 2025
WA Mining Club luncheons are valuable ways to network with colleagues and clients and learn about the latest industry insights.
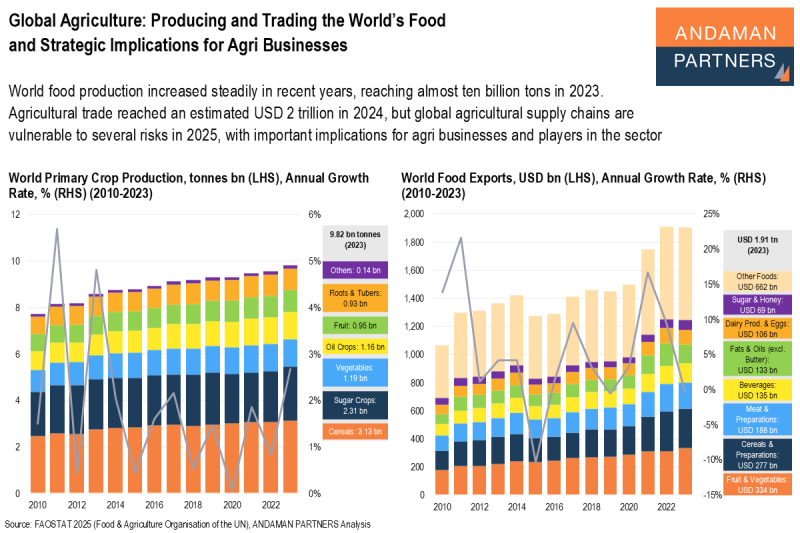
Global Agriculture: Producing and Trading the World’s Food and Strategic Implications for Agri Businesses
Global agricultural supply chains are vulnerable to several risks in 2025, with important implications for agri businesses and players in the sector.

Southeast Asia: The USD 4-trillion Economy
With rapid GDP growth, expanding trade networks and investment inflows, Southeast Asia retains its enduring appeal as a vital destination for multinational corporations seeking to diversify their supply chains and tap into Asia’s growing consumer markets.

Indonesia’s Dynamic Economic Growth Story Offering Opportunities for Global Businesses
Indonesia’s dynamic, services-led and consumption-driven economy is poised to become one of the world’s largest by mid-century, presenting many opportunities for businesses and investors.