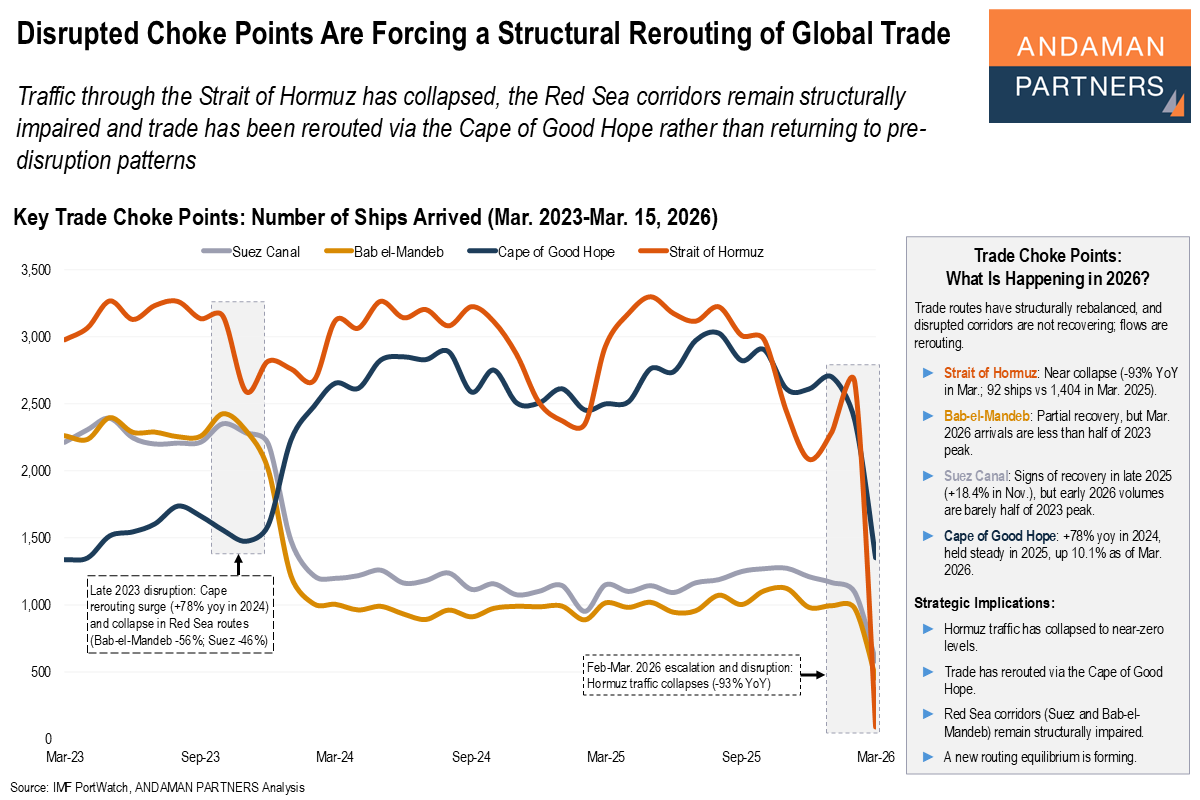
Disrupted Choke Points Are Forcing a Structural Rerouting of Global Trade
Traffic through the Strait of Hormuz has collapsed, the Red Sea corridors remain structurally impaired and trade has been rerouted via the Cape of Good Hope.
Traffic through the Strait of Hormuz has collapsed, the Red Sea corridors remain structurally impaired and trade has been rerouted via the Cape of Good Hope.
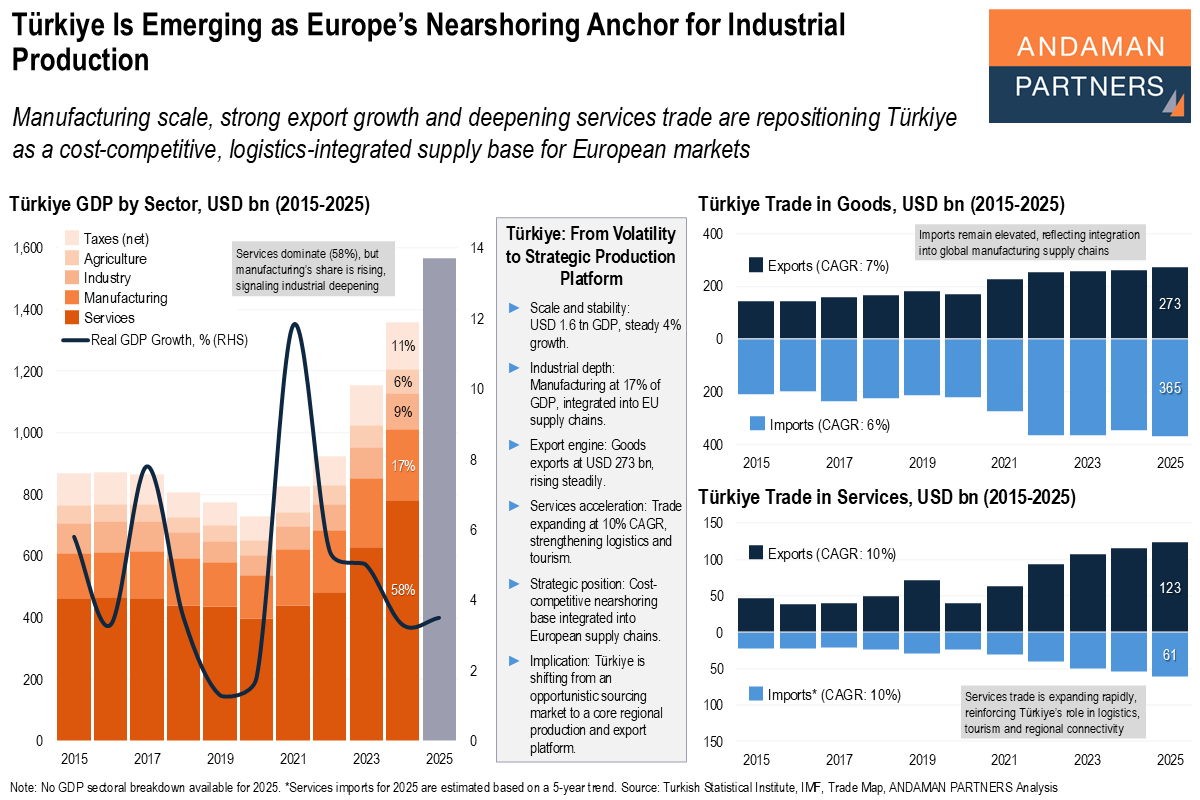
Manufacturing scale, strong export growth and deepening services trade are repositioning Türkiye as a cost-competitive supply base for Europe.
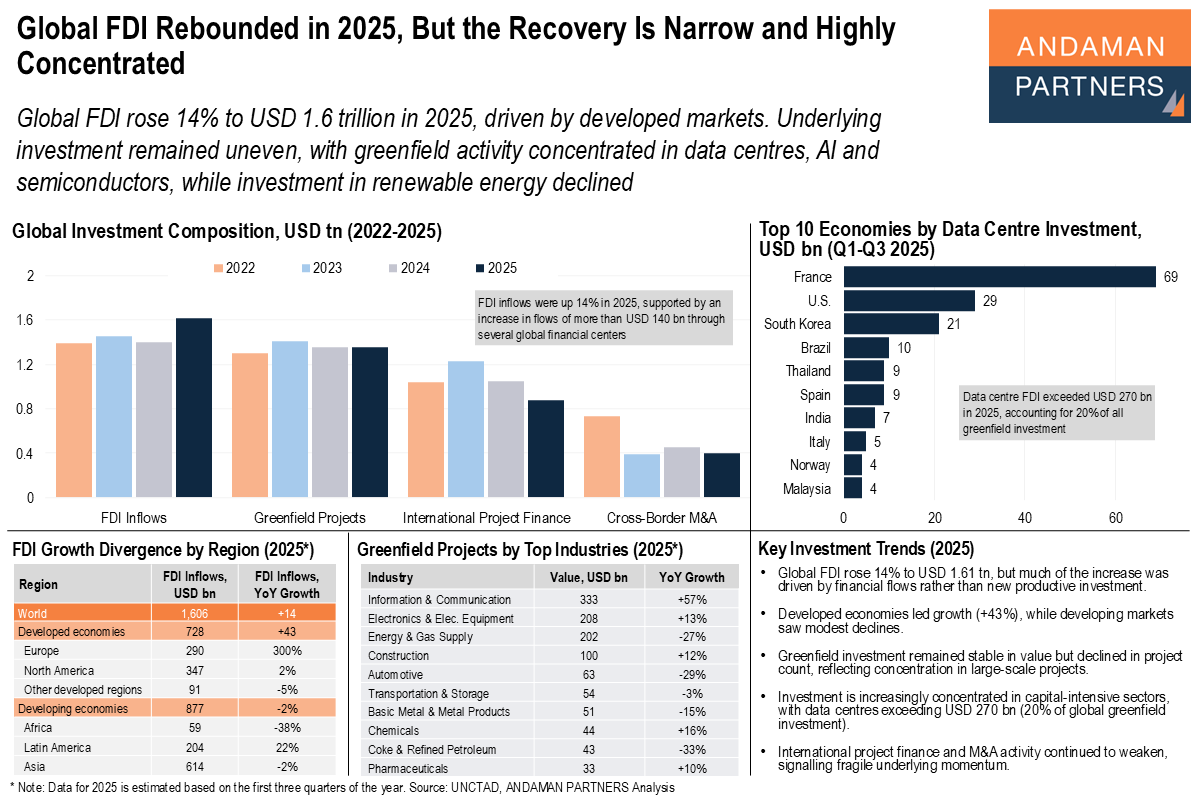
Investment remained uneven, with greenfield activity concentrated in data centres, AI and semiconductors, while investment in renewable energy declined.
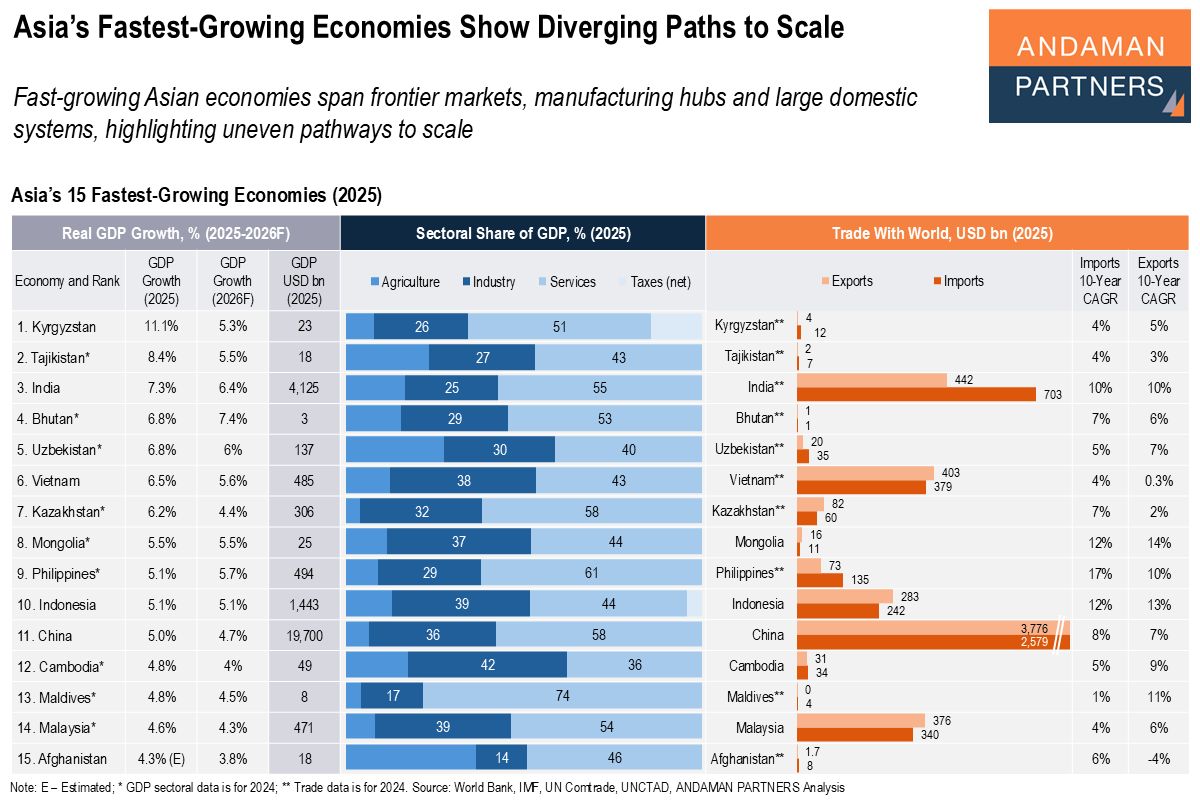
Fast-growing Asian economies span frontier markets, manufacturing hubs and large domestic systems, highlighting uneven pathways to scale.
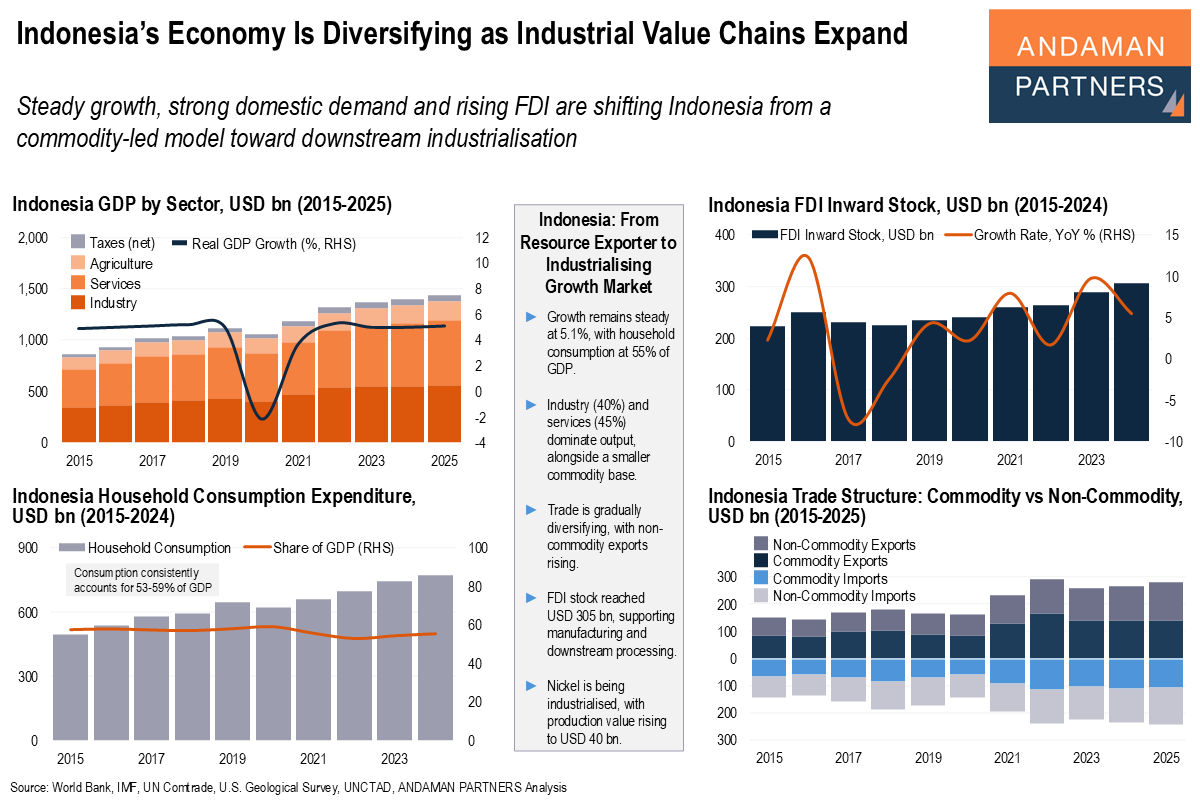
Steady growth, strong domestic demand and rising FDI are shifting Indonesia from a commodity-led model toward downstream industrialisation.
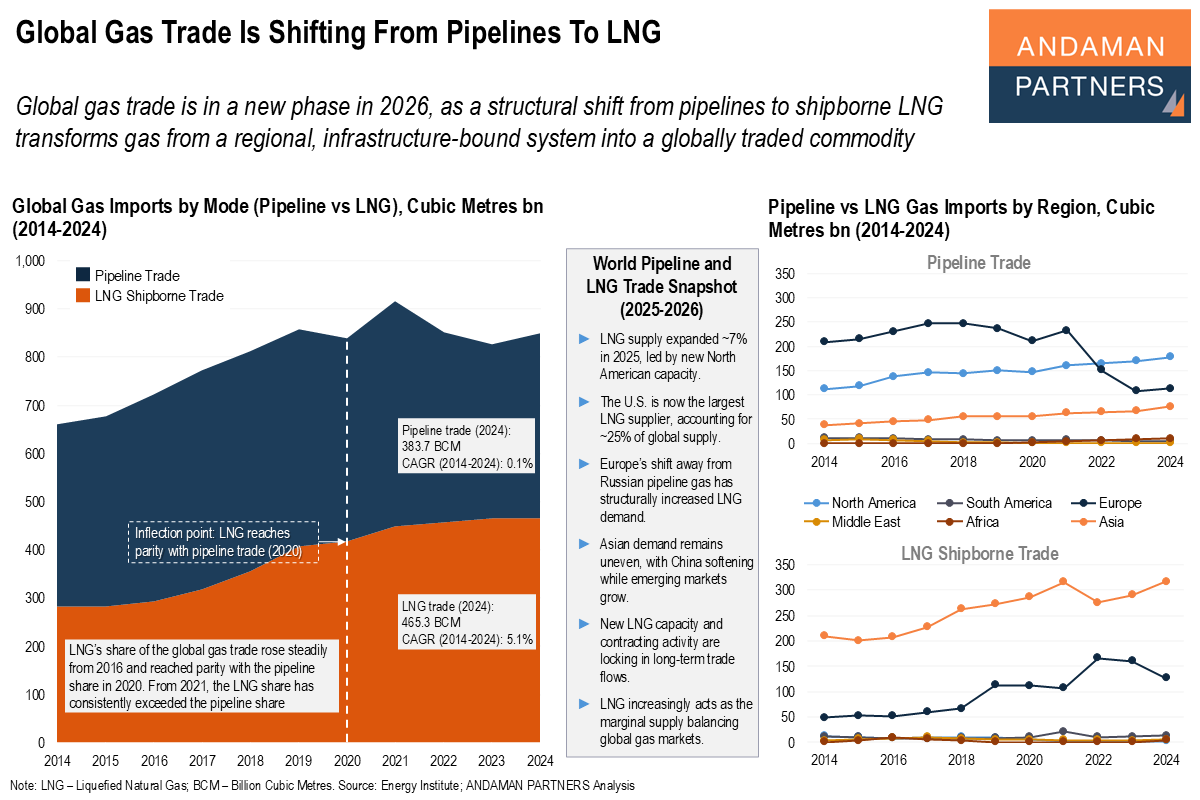
Global gas trade is in a new phase in 2026 amid a structural shift from pipelines to shipborne LNG.
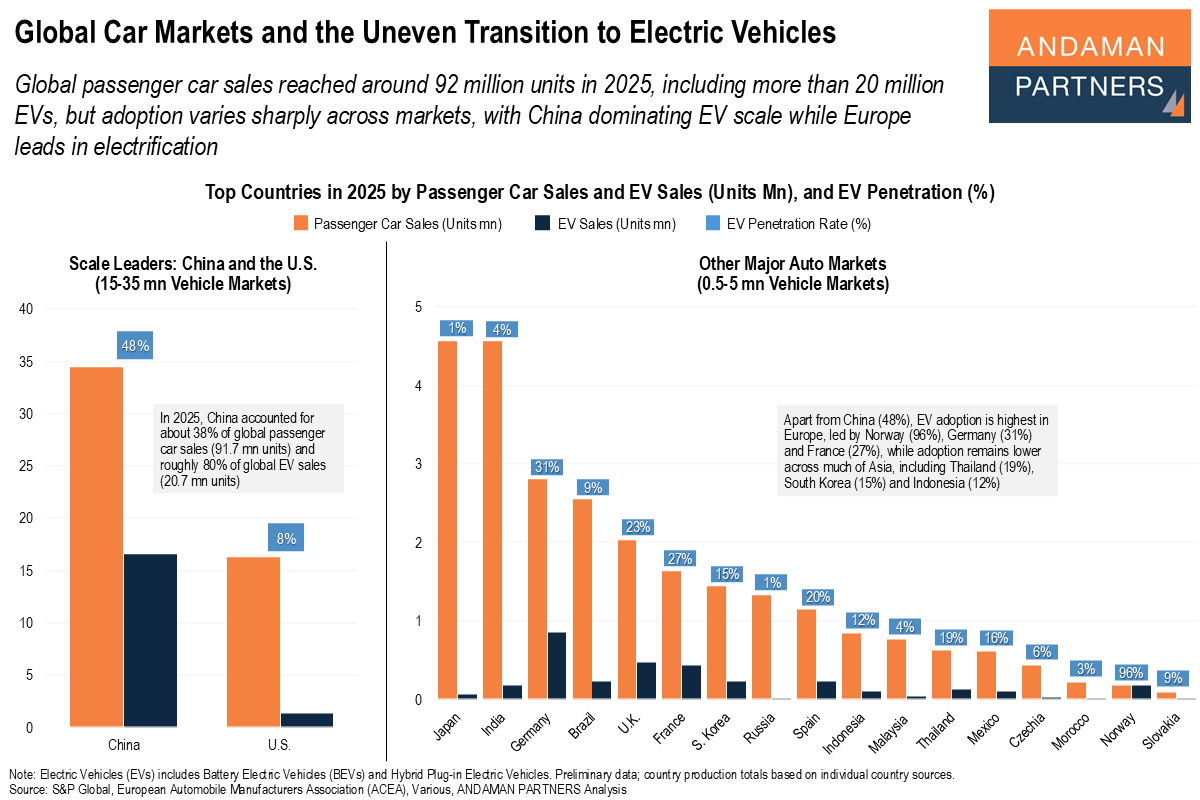
Global passenger car sales reached 92 million units in 2025, including more than 20 million EVs, but adoption varies widely across markets.
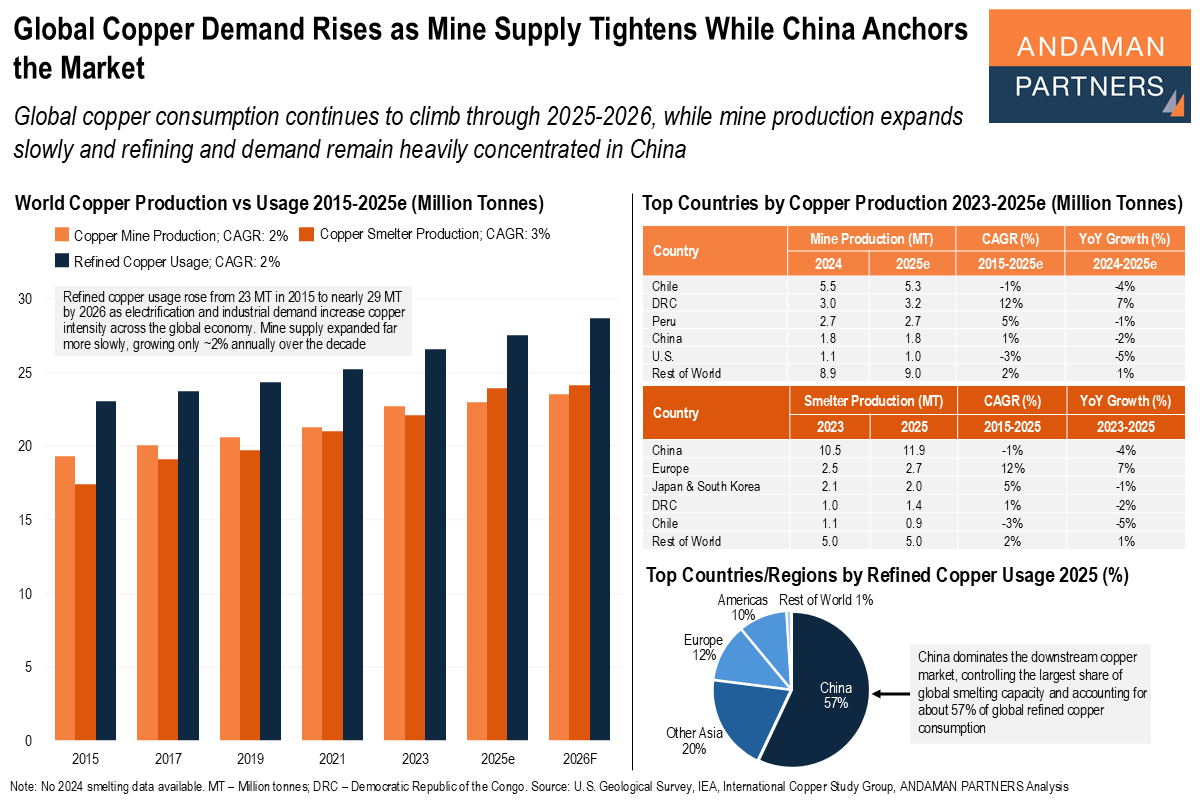
Global copper consumption continues to climb, and mine production expands slowly, while refining and demand remain heavily concentrated in China.
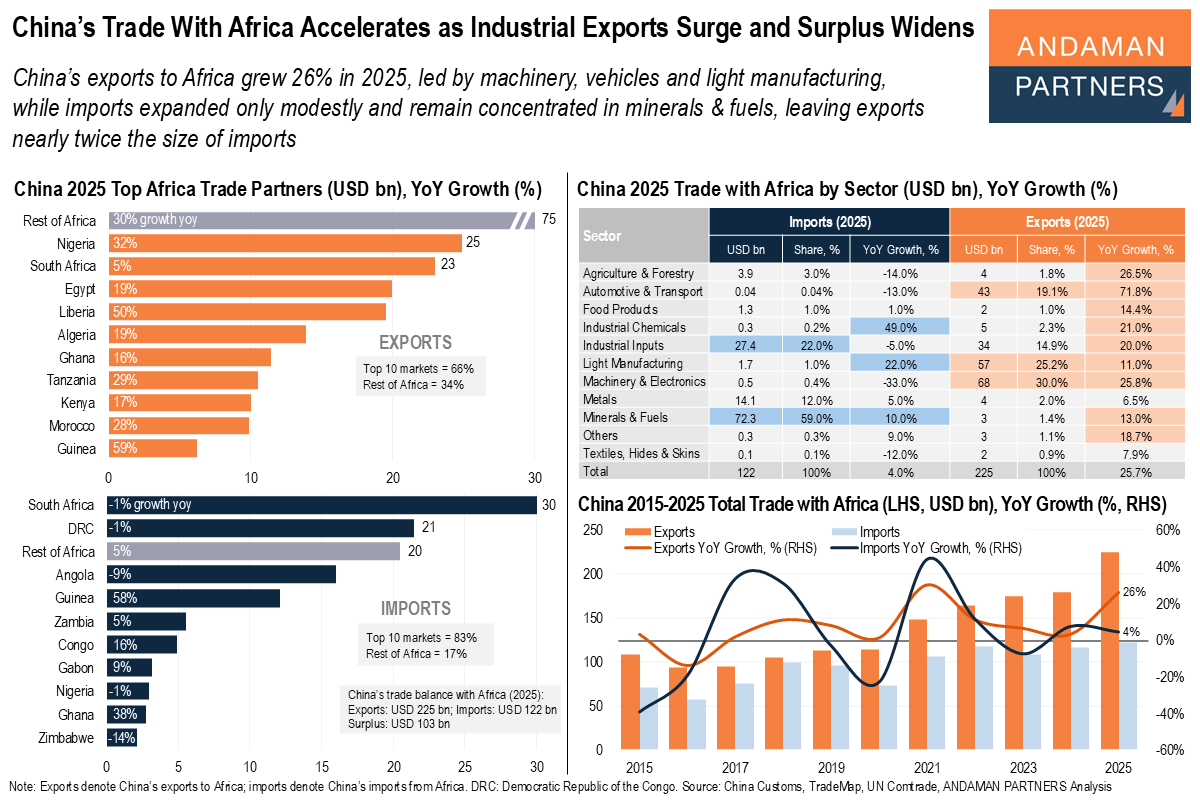
China’s exports to Africa grew 26% in 2025, led by machinery, vehicles and light manufacturing, while imports expanded only modestly.
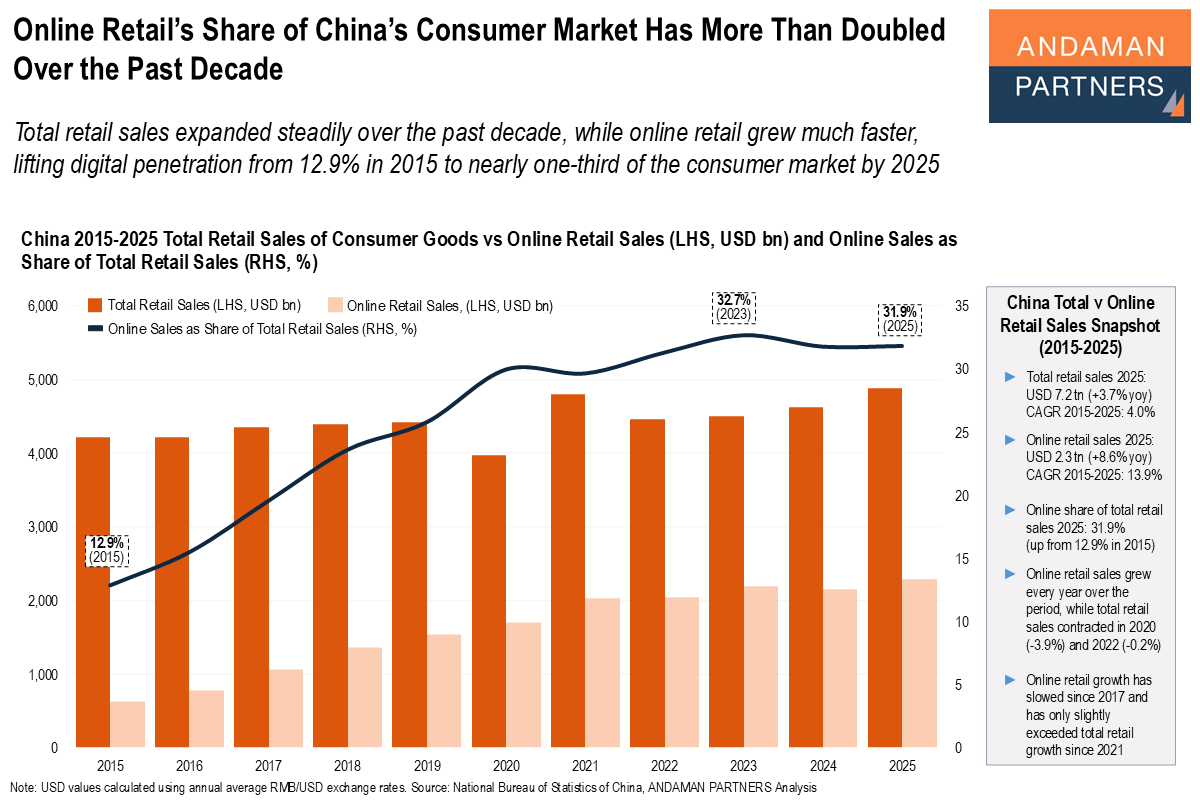
Total retail sales expanded steadily over the past decade, while online retail grew much faster, lifting digital penetration to 32% by 2025.