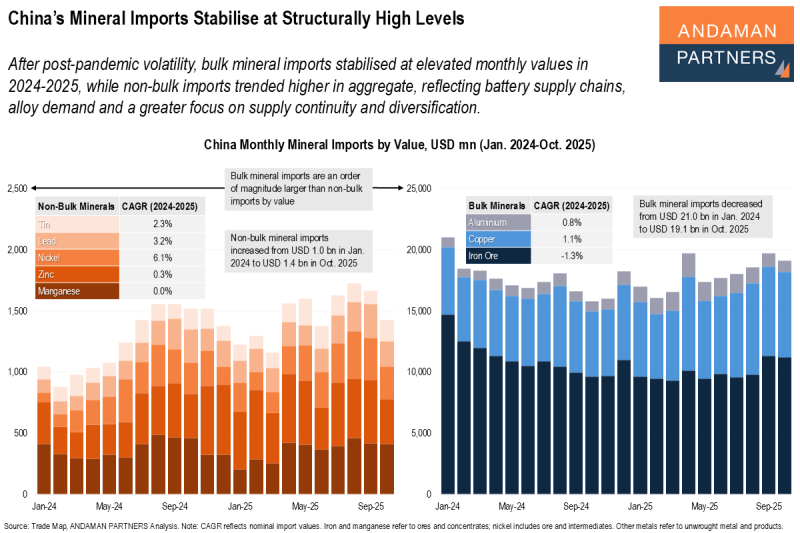
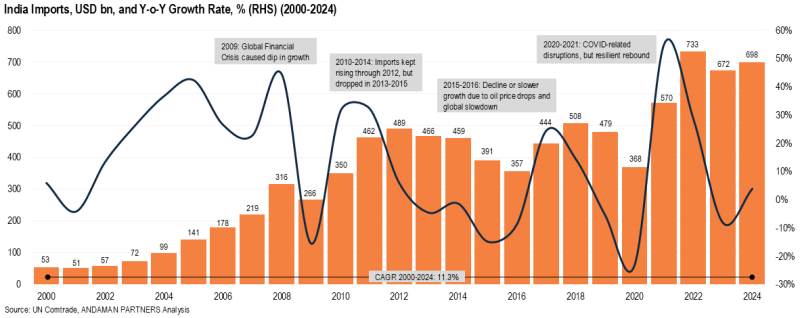
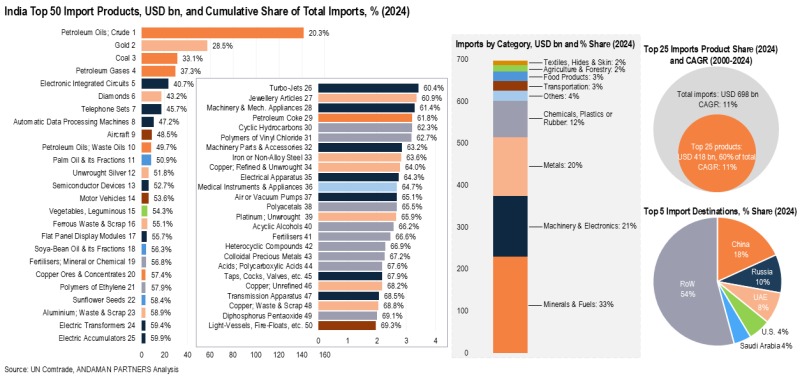
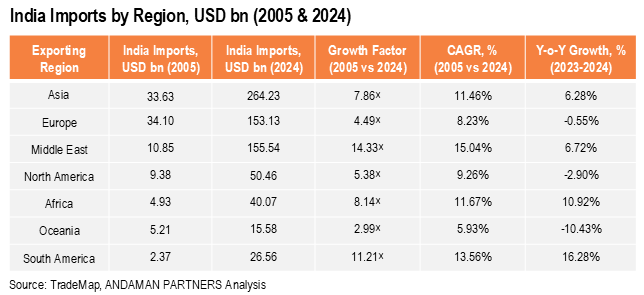
 On a regional basis, from 2005 to 2024, India’s imports from the Middle East expanded at the fastest rate, with a CAGR of 15% and a growth factor of 14.3. Imports from South America also expanded rapidly over this period, with a CAGR of 13.5% and a growth factor of 11.2, followed by Africa (CAGR: 11.7%), Asia (11.5%), North America (9.3%) and Europe (8.2%). India’s imports from Oceania grew at only 6% over this period, the slowest among all the regions.

ANDAMAN PARTNERS Attended the Australia Governance Summit 2026 in Sydney
ANDAMAN PARTNERS Co-Founder Kobus van der Wath attended the Australia Governance Summit (AGS26) in Sydney, Australia.

ANDAMAN PARTNERS Wishes You a Happy and Prosperous Year of the Horse!
Compliments of the Chinese Lunar New Year to all our clients, customers, suppliers and partners.

ANDAMAN PARTNERS to Attend Investing in African Mining Indaba 2026 in Cape Town
ANDAMAN PARTNERS Co-Founders Kobus van der Wath and Rachel Wu will attend Investing in African Mining Indaba 2026 in Cape Town, South Africa.
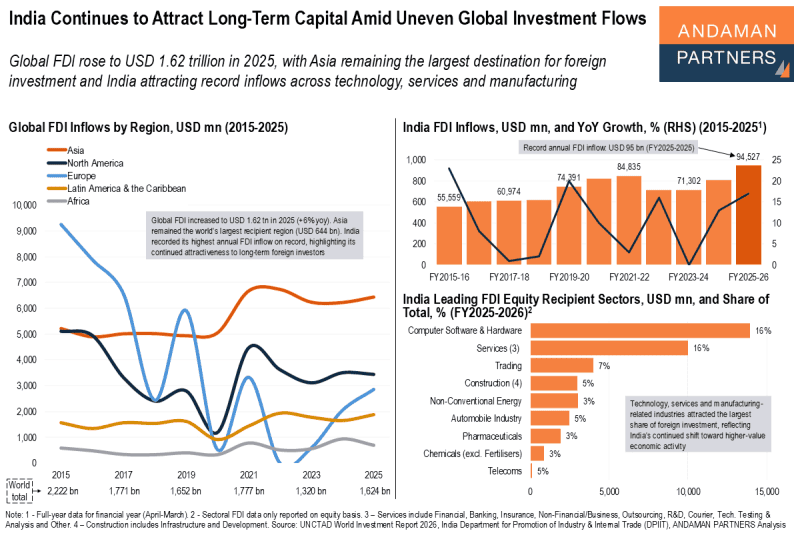
India Continues to Attract Long-Term Capital Amid Uneven Global Investment Flows
Global FDI rose to USD 1.62 trillion in 2025, with Asia remaining the largest destination and India attracting record inflows
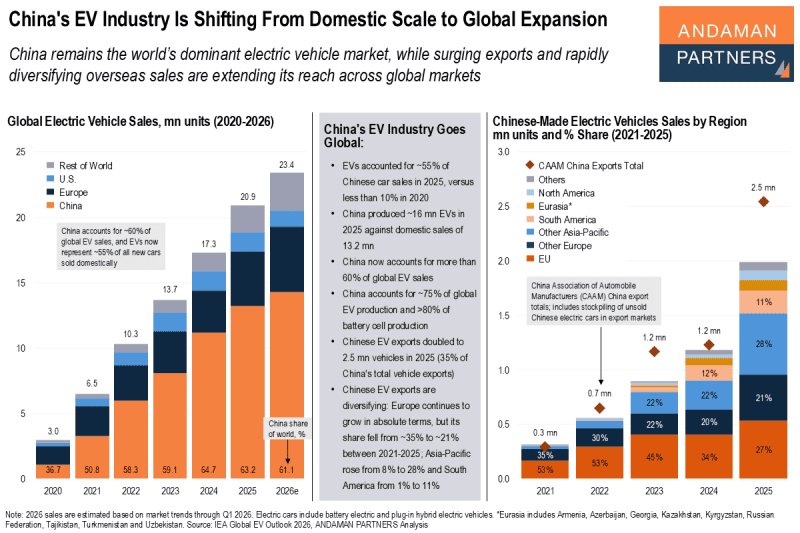
China’s EV Industry Is Shifting From Domestic Scale to Global Expansion
China is the world’s dominant EV market, and surging exports and diversifying overseas sales are extending its reach across global markets
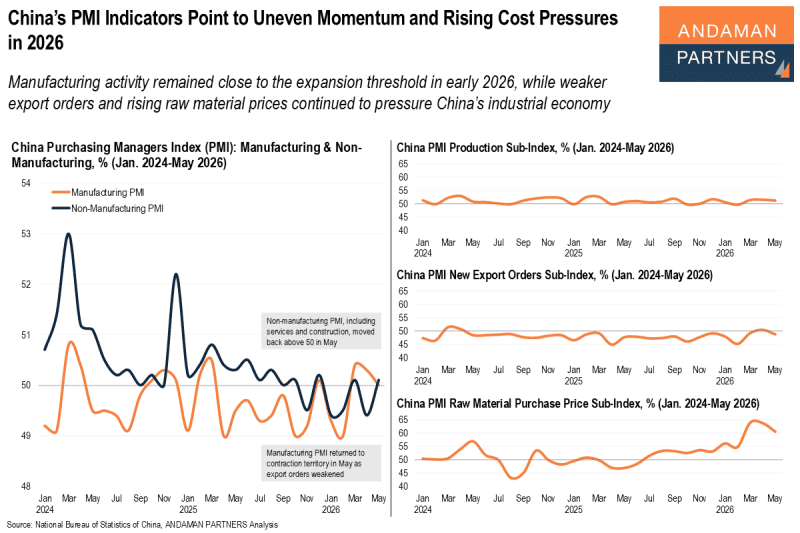
China’s PMI Indicators Point to Uneven Momentum and Rising Cost Pressures in 2026
Manufacturing activity remained close to expansion in early 2026, while weaker export orders and raw material prices pressure the economy