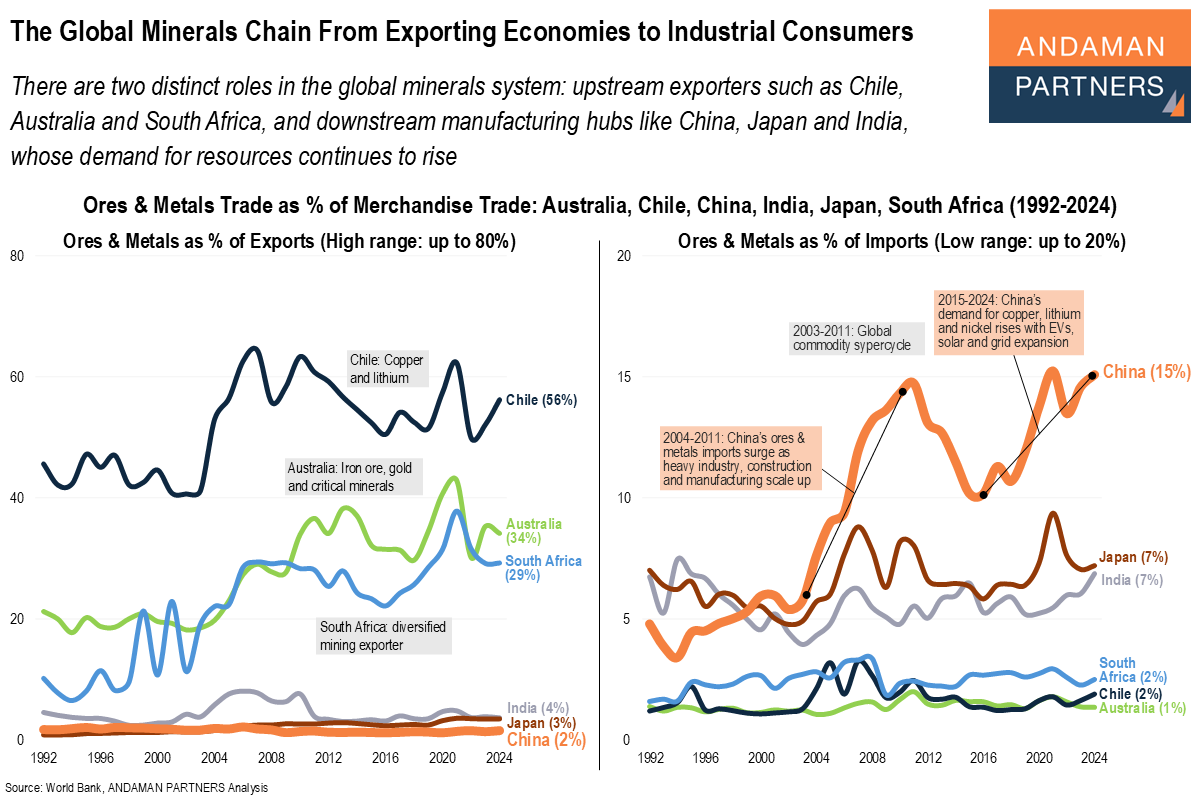
Global trade in ores & metals reveals a structural divide that has shaped the world economy for decades: a small group of upstream exporters supplies the raw minerals, while a different set of industrial economies consumes them at scale. The data for Australia, Chile, South Africa, China, Japan and India since 1992 illustrate this bifurcation with exceptional clarity and show how China’s rise as the world’s manufacturing centre has reshaped global demand for minerals.
On the supply side, Chile, Australia and South Africa anchor the export end of the minerals chain. Chile’s ores and metals exports consistently account for more than half its merchandise trade, reflecting its global leadership in copper and lithium. Australia similarly shows a high export share of 34%, driven by iron ore, gold and a rapidly growing portfolio of critical minerals. South Africa, while more diversified, remains firmly positioned as an upstream mining economy, with ores & metals accounting for 29% of its exports. These three economies demonstrate the structural reality that global ore & mineral supply is geographically concentrated in a handful of specialised exporters.
The demand side tells a different story. China’s share of global ores & metals imports has risen sharply since the early 2000s, climbing from low single digits to around 15%. This surge reflects the scaling of heavy industry, construction, manufacturing and infrastructure from 2004 onward. It underscores how China’s industrialisation phase was built on imported iron ore, copper, aluminium and other base metals. A second wave of demand emerged after 2015, driven by electric vehicles (EVs), solar power and broader electrification, significantly increasing China’s reliance on imported copper, lithium and nickel. As China moves further up the manufacturing value chain, its dependence on metal imports has become structural rather than cyclical.
Japan and India illustrate parallel dynamics at different stages of development. Japan, long a resource-poor industrial economy, has maintained a stable but elevated ores & metals import share of around 7%, providing a mature reference point for China’s long-term trajectory. India, by contrast, is in the early stages of a similar arc. As its manufacturing base and infrastructure scale up, its import share has begun to rise, foreshadowing stronger minerals demand in the decade ahead.
Together, these six economies illustrate a global minerals system defined by asymmetry: exporters like Chile, Australia and South Africa supply the raw materials, while industrial consumers like China, Japan and India absorb them. China’s rising import share, now far higher than those of other major manufacturing economies, underscores the critical role of a stable mineral supply to its economic model and global markets.