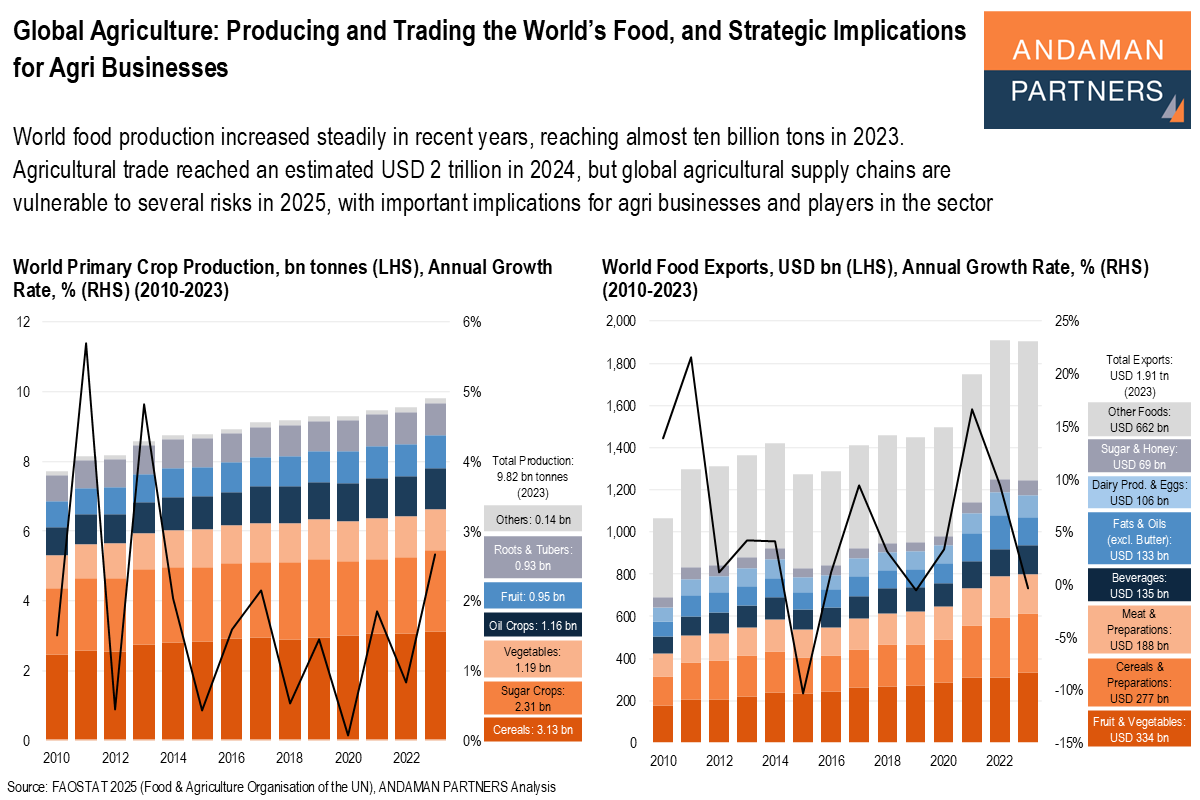
World food production increased steadily in recent years, reaching almost ten billion tons in 2023. Agricultural trade reached an estimated USD 2 trillion in 2024, but global agricultural supply chains are vulnerable to several risks in 2025, with important implications for agri businesses and players in the sector.
Highlights:
- In 2023, the world produced almost 10 billion tonnes of primary agricultural crops, a third of which were cereals, the world’s primary staple foods. Other billion-ton-plus categories were sugar crops, vegetables and oil crops.
- China has the world’s most extensive agricultural production base by a considerable margin. Other countries with large agrarian production bases are India, the U.S. and Brazil.
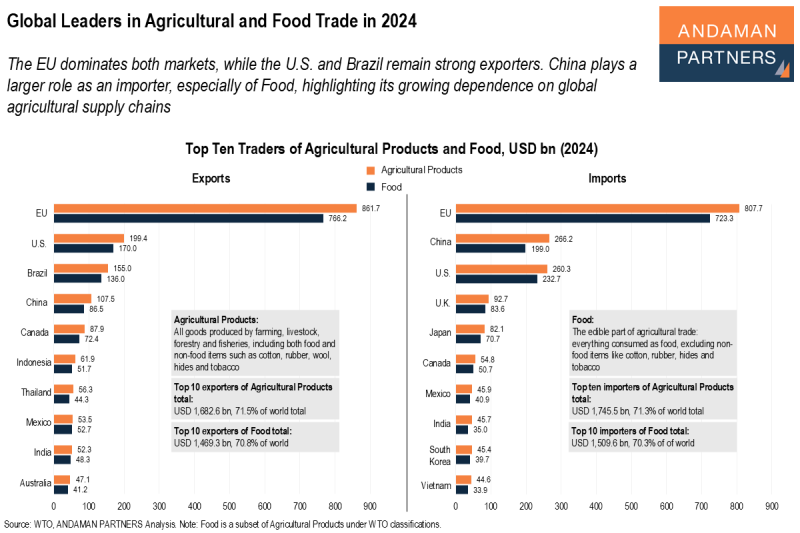
- Agricultural trade in 2024 is estimated to have exceeded USD 2 trillion, a 2.2% increase from 2023.
- The Americas, Europe and Oceania are net food-exporting regions, while Africa and Asia are net food-importing regions.
- Analysis of global agricultural production and trade data reveals several strategic implications for agribusinesses to navigate the evolving supply chain landscape in 2025 and beyond.
In 2023, the world produced 9.82 billion tonnes of primary crops, a 2.8% increase year-on-year and around 2 billion tonnes more than in 2010.[1] Compared to processed foods (e.g., flour and sugar) and industrial crops (e.g., cotton and tobacco), primary crops are harvested directly from the field in their raw state and do not undergo substantial processing.
A third of the total, 3.13 billion tonnes, consisted of cereals, including around 17 crops that constitute the world’s staple foods and the foundation of global food security. Rice is the primary staple food in Asia; wheat is dominant in Europe and North America; maize, sorghum and millet are common in Africa; and maize is the traditional food base in Latin America.
At 2.31 billion tonnes, sugar crops, primarily sugar cane and sugar beet, used to produce sugar as well as for industrial purposes (notably to produce ethanol and bioenergy), were the second-largest category of agricultural production. The following largest categories were a group of up to 80 vegetable crops (1.19 billion tonnes), around 20 oil crops (mainly oil palm fruit and soybeans) used to extract vegetable oils (1.16 billion tons), up to 90 fruit crops (952 million tons) and roots & tubers (underground food crops with enlarged roots or stems), mainly potatoes, cassava, sweet potatoes and yams (928 million tonnes).
These six main categories accounted for 98.5% of global primary crop production
[1] Unless otherwise stated, this article uses data from the Food & Agriculture Organisation of the United Nations (FAO), of which the most recent set of full annual data is for 2023.
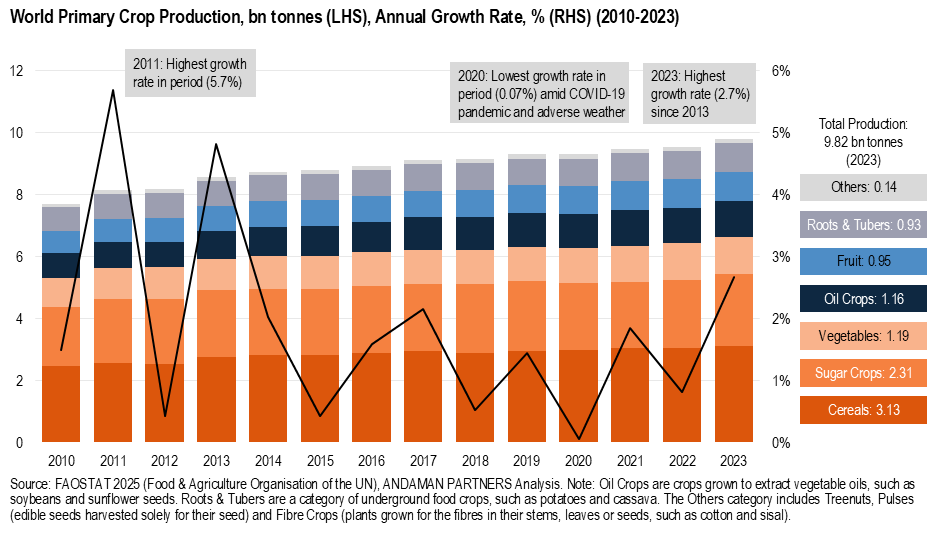
Global primary agricultural production has steadily increased in recent years, from below 8 billion tonnes in 2010 to almost 10 billion tonnes in 2023. This increase was driven by the enhanced use of production technologies, expansion of cultivated areas and greater use of irrigation, pesticides, fertilisers and high-yielding crop varieties. Notable examples of the latter include hybrid rice in China and India, Quality Protein Maize in Mexico and high-sucrose sugarcane in Brazil.
The growth rate of global crop production has fluctuated since 2010. Production peaks of 4-6% in 2011 and 2013 were mainly due to favourable weather conditions, rebound effects from previous low-output years and rising demand. The smallest expansion was recorded in 2020 (0.7%), mainly due to economic and logistical disruptions caused by the COVID-19 pandemic, particularly shortages of fertiliser, which were exacerbated by localised weather extremes, notably droughts in parts of Africa and South America.
From 2015, growth fluctuated below 3%, reaching 2.7% in 2023, facilitated by favourable weather conditions in key regions such as the U.S., Brazil, India and Southeast Asia; accelerated adoption of high-yielding and climate-resilient crop varieties; and higher global commodity prices in 2022 and early 2023, which provided farmers with an incentive to plant and invest.
Classification of Major Agricultural Crops by Primary Use:
- Food Crops (for human consumption): Wheat, Rice, Maize (Corn), Potatoes, Cassava
- Animal Products (for human consumption): Meat, Dairy, Eggs
- Feed Crops (for livestock consumption): Wheat, Maize (Corn), Sorghum, Barley, Oats, Alfalfa
- Fibre Crops (for use in textile and paper products): Cotton, Jute, Hemp, Flax, Sisal
- Oil Crops (for human consumption and industrial uses): Soybeans, Sunflowers, Canola (Rapeseed), Palm Oil, Peanuts, Olives
- Industrial Crops (for use in factories and machines): Rubber, Tobacco, Cotton, Hemp, Lavender, Sugar Cane, Sugar Beet
- Ornamental Crops (for use in landscape gardening): Roses, Tulips, Orchids, Lilies
Cereals[1]
- Total Production (2023): 3.13 billion tonnes.
- Main Crops: Maize, Rice, Wheat (91% of total):
- Maize: 1.24 billion tonnes.
- Rice: 800 million tonnes (unmilled), 535 million tonnes (milled).
- Wheat: 799 million tonnes.
- Main Producers:
- Maize: U.S. (390 million tonnes), China (289 million tonnes), Brazil (132 million tonnes), Argentina (41 million tonnes), India (38 million tonnes).
- Rice: India (207 million tonnes), China (207 million tonnes), Bangladesh (59 million tonnes), Indonesia (54 million tonnes), Vietnam (43 million tonnes).
- Wheat: China (137 million tonnes), India (111 million tonnes), Russia (92 million tonnes), U.S. (49 million tonnes), Australia (41 million tonnes).
- Production Forecasts for 2024:
- Maize: 1.22 billion tonnes (U.S. Dept. of Agriculture, USDA).
- Rice (milled): 544 million tonnes (FAO); 531 million tonnes (USDA).
- Wheat: 797 million tonnes (USDA).
Sugar Crops
- Total Production (2023): 2.31 billion tonnes.
- Main Crops: Sugar Cane, Sugar Beet (99% of total):
- Sugar Cane: 2.03 billion tonnes.
- Sugar Beet: 281 million tonnes.
- Main Producers:
- Sugar Cane: Brazil (783 million tonnes), India (491 million tonnes), China (105 million tonnes), Thailand (94 million tonnes), Pakistan (88 million tonnes).
- Sugar Beet: Russia (49 million tonnes), U.S. (32 million tonnes), Germany (32 million tonnes), France (31 million tonnes), Türkiye (25 million tonnes).
- Production Forecasts for 2024: n/a
Vegetables
- Total Production (2023): 1.19 billion tonnes.
- Main Crops: Fresh Other Vegetables,[2] Tomatoes, Dry Onions & Shallots, Cucumbers & Gherkins, Cabbages (65% of total):
- Fresh Other Vegetables: 293 million tonnes.
- Tomatoes: 192 million tonnes.
- Dry Onions & Shallots: 111 million tonnes.
- Cucumbers & Gherkins: 98 million tonnes.
- Cabbages: 74 million tonnes.
- Main Producers (all Vegetables):
- China (619 million tonnes).
- India (145 million tonnes).
- S. (31 million tonnes).
- Türkiye (27 million tonnes).
- Vietnam (18 million tonnes).
- Production Forecasts for 2024: n/a
Oil Crops
- Total Production (2023): 1.16 billion tonnes.
- Main Crops: Oil Palm Fruit, Soybeans (67% of total):
- Oil Palm Fruit (409 million tonnes).
- Soybeans (371 million tonnes).
- Main Producers:
- Oil Palm Fruit: Indonesia (240 million tonnes), Malaysia (95 million tonnes), Thailand (18 million tonnes), Nigeria (12 million tonnes), Colombia (8 million tonnes).
- Soybeans: Brazil (152 million tonnes), U.S. (113 million tonnes), Argentina (25 million tonnes), China (19 million tonnes), India (15 million tonnes).
- Production Forecasts for 2024:
- Oil Palm Fruit: n/a
- Soybeans: 421 million tonnes (USDA)
Fruit
- Total Production (2023): 952 million tonnes.
- Main Crops: Bananas, Watermelons, Apples, Grapes, Oranges (51% of total):
- Bananas (139 million tonnes).
- Watermelons (105 million tonnes).
- Apples (97 million tonnes).
- Grapes (72 million tonnes).
- Oranges (70 million tonnes).
- Main Producers (all Fruit):
- China (269 million tonnes).
- India (114 million tonnes).
- Brazil (43 million tonnes).
- Türkiye (27 million tonnes).
- Mexico (26 million tonnes).
- Production Forecasts for 2024:
- Apples: 84 million tonnes (USDA)
Roots & Tubers
- Total Production (2023): 928 million tonnes.
- Main Crops: Potatoes, Cassava, Sweet Potatoes (87% of total):
- Potatoes (383 million tonnes).
- Cassava (334 million tonnes).
- Sweet Potatoes (94 million tonnes).
- Main Producers:
- Potatoes: China (93 million tonnes), India (60 million tonnes), Ukraine (22 million tonnes), U.S. (20 million tonnes), Russia (19 million tonnes).
- Cassava: Nigeria (63 million tonnes), D.R.C. (45 million tonnes), Thailand (31 million tonnes), Ghana (27 million tonnes), Brazil (19 million tonnes).
- Sweet Potatoes: China (51 million tonnes), Malawi (8 million tonnes), Tanzania (5 million tonnes), Nigeria (4 million tonnes), Angola (2 million tonnes).
- Production Forecasts for 2024: n/a
[1] Figures in this section have been rounded.
[2] Fresh Vegetables, Other n.e.c. includes fresh vegetables that are not reported individually due to their smaller scale or regional specificity, such as leafy greens and herbs.
Production Capacity and Specialisation
Gross Production Value (GPV) of the Agricultural Sector is an economic indicator reported by the FAO that records the monetary value of all agricultural goods produced within a country, measured at producer prices and in constant terms to account for the effects of inflation. GPV indicates the scale, composition and specialisation of a country’s agricultural sector.
GPV data for the period 2000-2023 illustrates the remarkable development of China’s agricultural sector. Over this period, China consistently recorded the world’s largest GPV, with the gap widening over the years. From USD 311 billion in 2000, China’s GPV increased fivefold to almost USD 1.70 trillion in 2023, when the country accounted for a third (33.2%) of the global total of just over USD 5 trillion. Far behind China, India (USD 537 billion) had the second-largest GPV, followed by the U.S. (USD 460 billion).
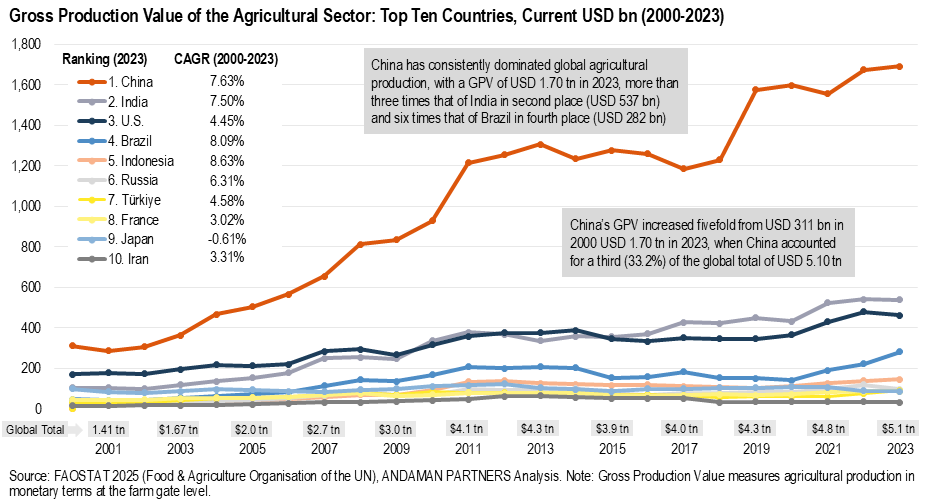
From 2000 to 2023, China’s GPV was also among the fastest-growing at 7.6%, behind only Indonesia (8.6%) and Brazil (8.0%).
In 2023, the top ten countries accounted for 69% of global GPV.
- China:[1]
- GPV: USD 1.69 trillion (2023)
- Specialisation: Largest producer of Wheat (18% global share); Rice (27%); Pork (49%); Potatoes; various Vegetables including Cabbages, Carrots and Tomatoes; various Fruits including Pears (78%), Grapefruit (76%), Tangerines (72%) and Apples (57%); Cotton (26%); Walnuts (56%); second-largest producer of Maize (24%).
- India
- GPV: USD 537 billion (2023)
- Specialisation: Largest producer of Butter (58%) and Millet (43%); second-largest producer of Rice (27%, on par with China), Cotton (21%) and Sugar Cane; third-largest producer of Wheat (14%).
- U.S.
- GPV: USD 460 billion (2023)
- Specialisation: Largest producer of Maize (31%), Beef (20%), Chicken Meat (21%) and Almonds (71%); second-largest producer of Soybeans (28%).
- Brazil
- GPV: USD 282 billion (2023)
- Specialisation: Largest producer of Orange Juice (70%), Soybeans (40%), Coffee (38%) and Sugar Cane (23%); third-largest producer of Maize (10%).
- Indonesia
- GPV: USD 144 billion (2023)
- Specialisation: Largest producer of Palm Oil (58%) and Oil Palm Fruit.
- Russia
- GPV: USD 96 billion (2023)
- Specialisation: Largest producer of Sunflowerseed and Sunflowerseed Oil (both 33%) and Sugar Beet; second-largest producer of Barley (11%); third-largest producer of Oats (13%); fourth-largest producer of Wheat (10%).
- Türkiye
- GPV: USD 89 billion (2023)
- Specialisation: Largest producer of Cherries (18%); second-largest producer of Pistachios (33%) and Lemons & Limes (16%); significant production of Sugar Beet, Wheat and Raw Milk.
- France
- GPV: USD 86 billion (2023)
- Specialisation: Significant production of Wheat, Sugar Beet, Raw Milk, Beverages, Maize and Barley.
- Japan
- GPV: USD 85 billion (2023)
- Specialisation: Significant production of Rice, Raw Milk, Sugar Beet, and Fish Meal.
- Iran
- GPV: USD 30 billion (2023)
- Specialisation: Third-largest producer of Pistachios (17%); significant production of Wheat, Sugar Cane, Cherries and Apples.
[1] Data in this section is by the U.S. Department of Agriculture and FAO.
Agricultural Trade
The total value of global agricultural exports in 2023 was USD 1.91 trillion, accounting for approximately 8% of global merchandise trade. The 2023 total was approximately 1.7 times larger than that of 2010 in nominal terms, but a slight decrease of 0.3% from 2022.
Food exports generally tend to track global commodity prices. The annual growth rate of food exports reached 21.6% in 2011 after cereal prices had attained record levels in 2007-2008. In 2015, the growth rate fell to -10.3% following a sharp decline in commodity prices. The growth rate climbed to 16.7% in 2021 amid the post-COVID-19 economic recovery, but declined in the succeeding years due to sluggish and uneven global growth, reaching -0.3% in 2023.
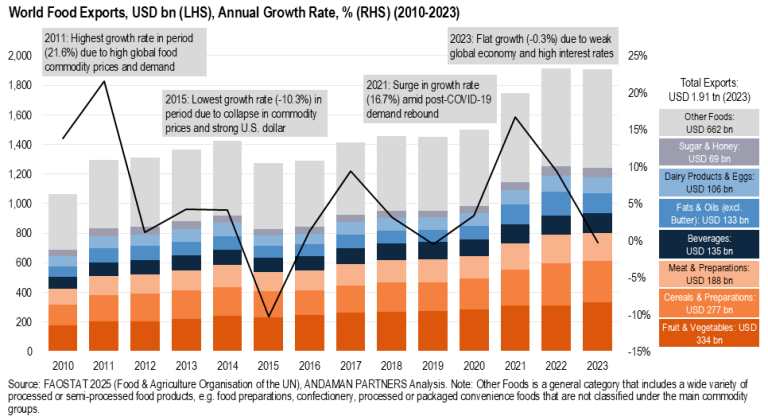
In 2023 and recent years, around half of global food exports consisted of Fruit & Vegetables (17.5%), Cereals & Preparations (14.6%), Meat & Meat Preparations (9.9%) and Beverages (7.1%). The largest single category in 2023 was Other Foods (34.8%). This general grouping includes a range of processed or semi-processed food products, such as confectionery, processed or packaged convenience foods, infant foods and nutritional supplements.
According to an FAO forecast, agricultural trade in 2024 is expected to exceed USD 2 trillion and increase 2.2% from 2023. The increase is primarily attributed to higher prices for certain commodities, notably cocoa, coffee and tea, which are expected to account for around half of the overall annual increase.
On a regional level, agricultural trade exhibits several clear trends. Food is generally exported from the West (mainly the Americas) to the East (mostly highly populated Asia), but there are also significant flows within the Americas and Europe. The Americas, Europe and Oceania are net food-exporting regions, while Africa and Asia are net food-importing regions.
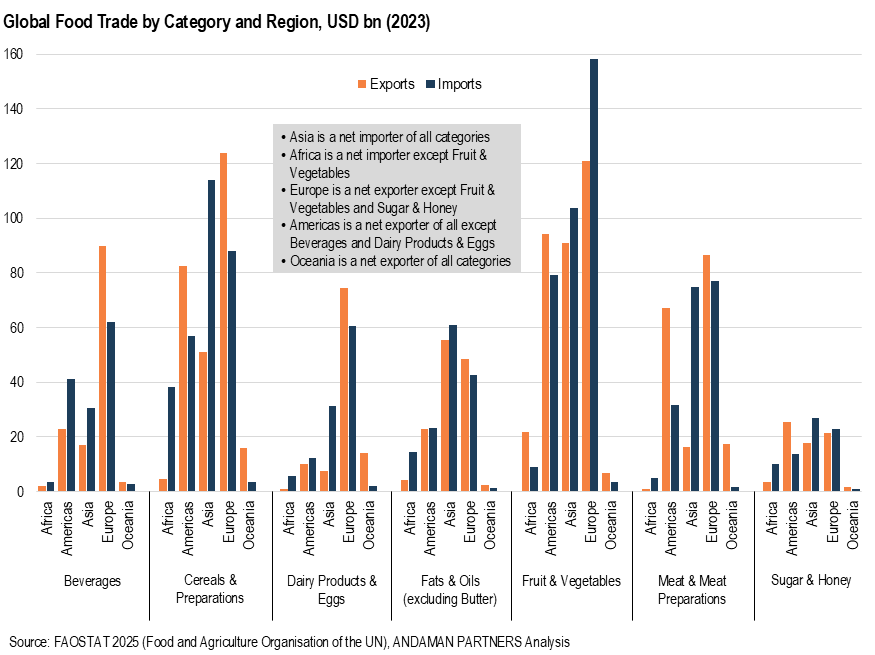
In 2023, Fruit & Vegetables was the only food category in which Africa was a net exporter. Africa must depend on imports for all the other food categories, from cereals to meat and beverages. Asia, in contrast, is dependent on imports for all categories, despite China being the world’s largest producer of vegetables and other foodstuffs.
Oceania is a net exporter of all food categories, and the Americas is a net exporter of all categories except Beverages and Dairy Products & Eggs.
According to the U.S. Department of Agriculture, the U.S. became a net food importer in 2019. Brazil and Argentina maintain significant annual food trade surpluses.
Europe became a net food-exporting region in 2013, and in 2023 was a net exporter of all categories except Fruit & Vegetables and Sugar & Honey.
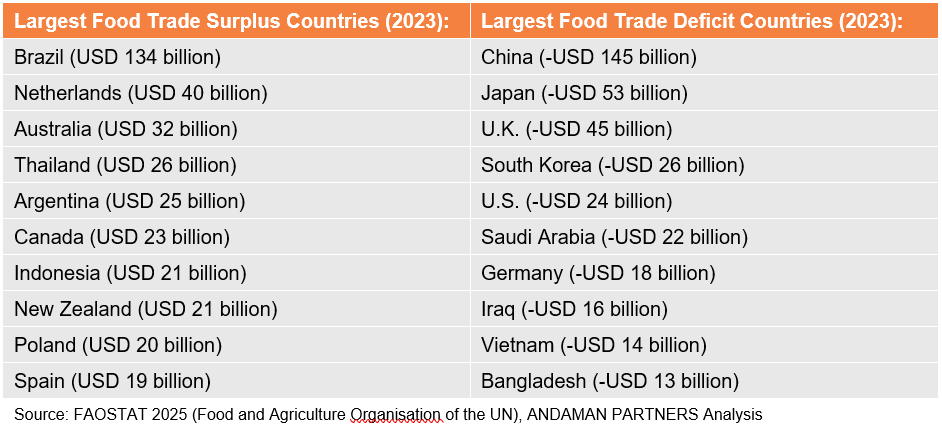
The most significant bilateral agricultural trade flow in 2023 was between Brazil and China, the world’s largest net food exporter and importer, respectively. Brazil exported USD 55.8 billion to China, two-thirds of which comprised Soybeans.
According to China Customs, from January to November 2024, China exported agricultural products worth USD 92.47 billion and imported products worth USD 196.99 billion, for a trade deficit of USD 104.52 billion, which declined 15.2% year-on-year.
The second- and third-largest trade flows were Canadian exports to the U.S. (USD 41.1 billion), primarily comprising baked goods, canola oil and meat; and Mexican exports to the U.S. (USD 40.7 billion), including a variety of commodities such as barley, tomatoes, avocados and chilli peppers.
The largest trade flows in Europe were Dutch exports to Germany (USD 31.8 billion), mainly consisting of Dairy Products and Fruit & Vegetables; and German exports to the Netherlands (USD 14.7 billion), mostly Dairy Products, Meat and Beverages.
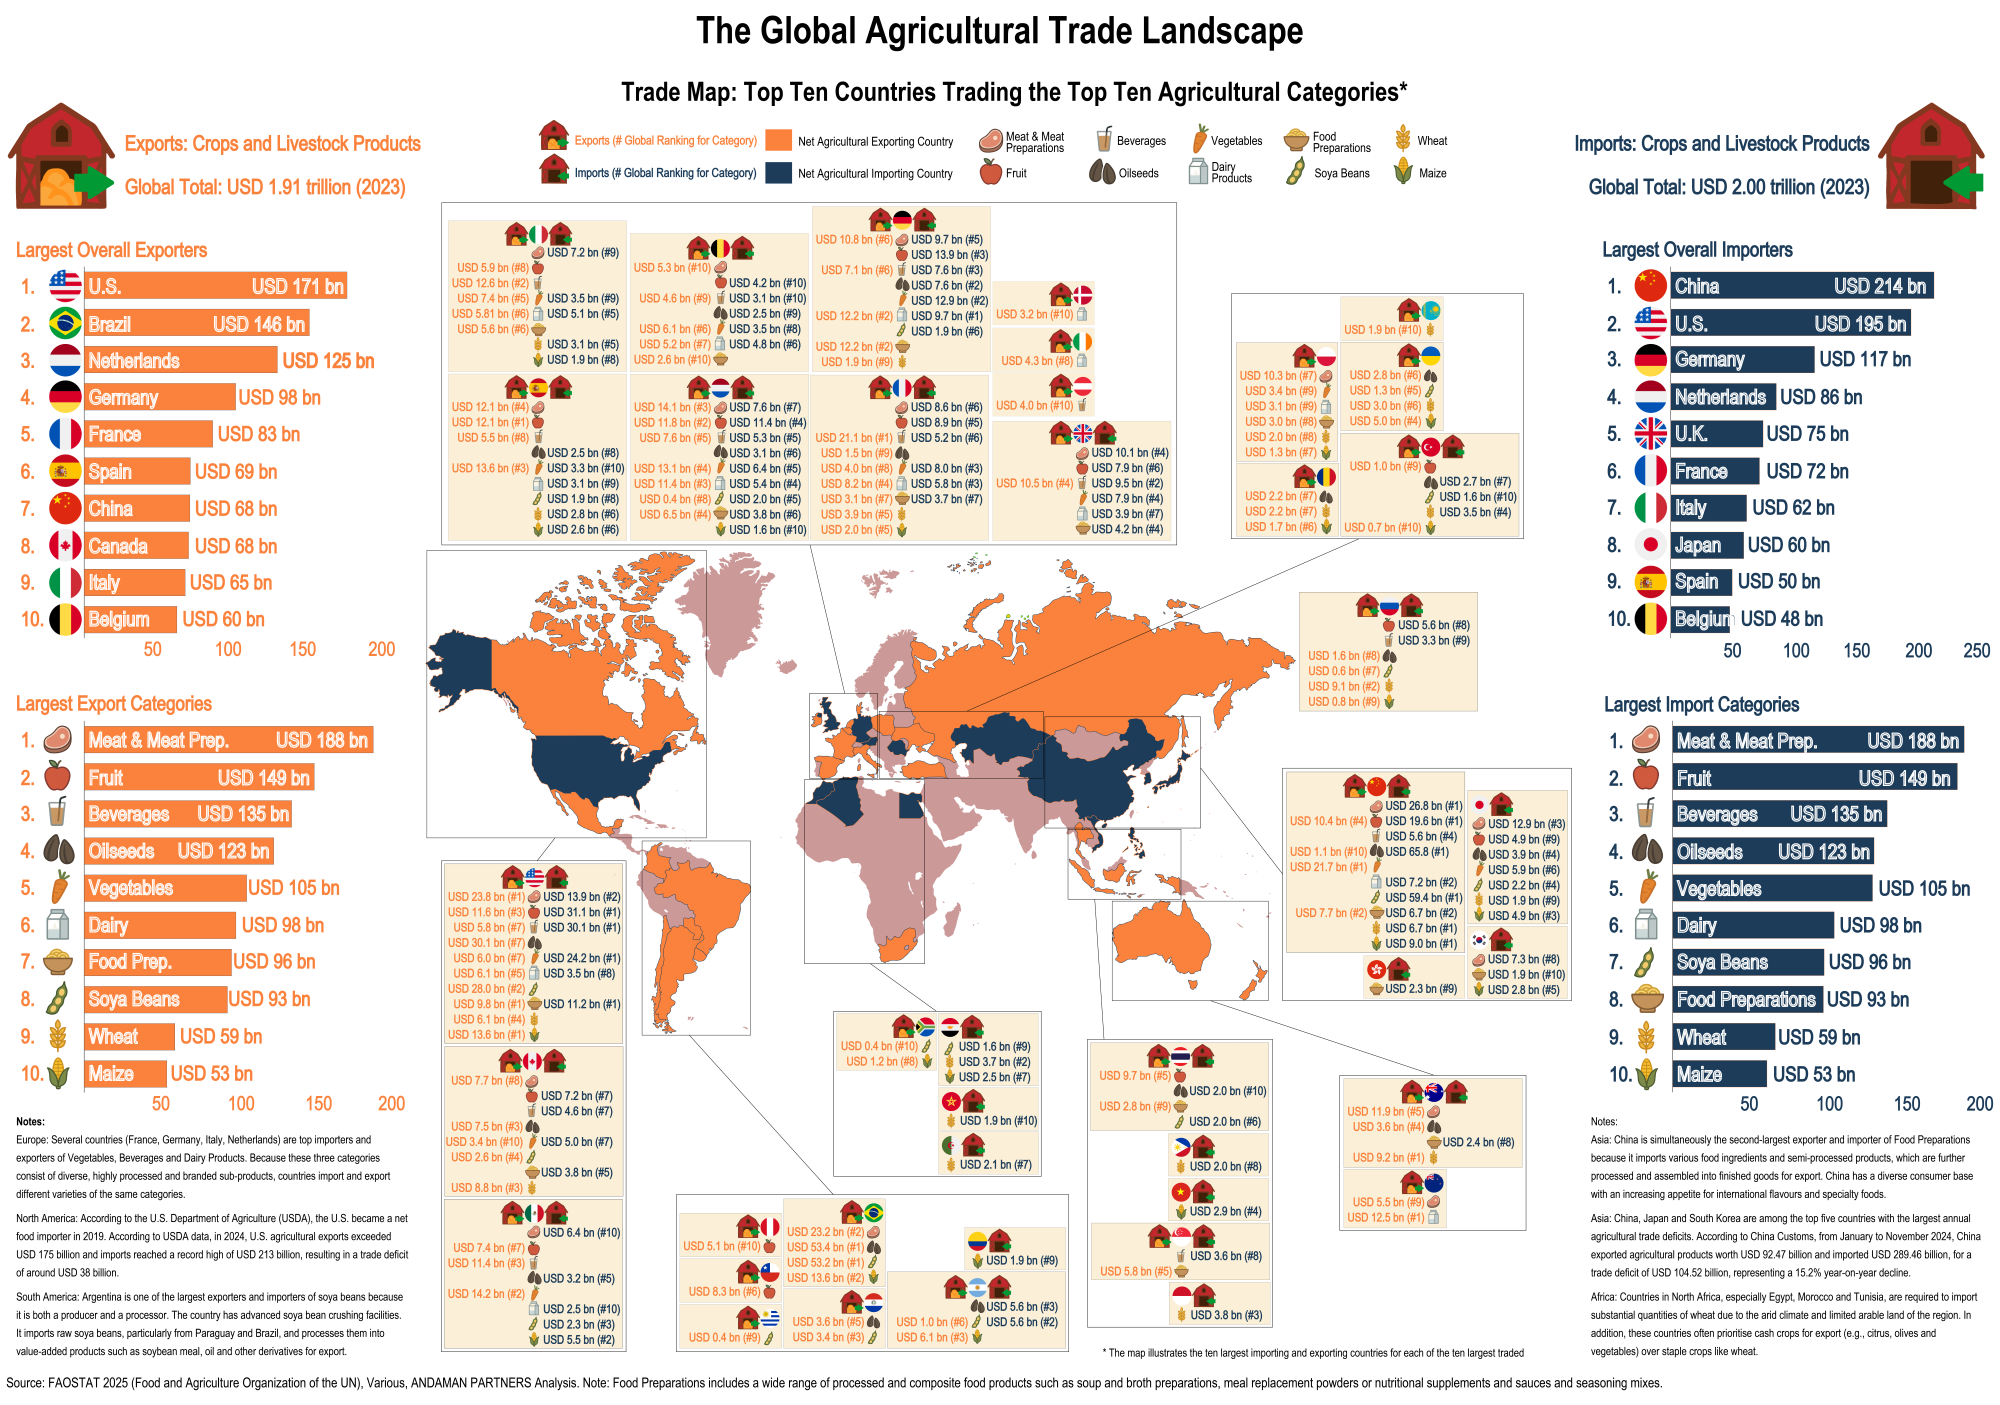
The Global Agricultural Trade Landscape map above categorises agricultural products separately, e.g., fruit, vegetables and individual cereals (wheat and maize). From this perspective, the largest single agricultural trade product was Meat & Meat Preparations, of which global exports in 2023 amounted to USD 188 billion, followed by Fruit (USD 149 billion) and Beverages (USD 135 billion).
Other prominent products among the top ten traded agricultural commodities are Oilseeds, including rapeseed, sunflower seeds and groundnuts (USD 123 billion); Vegetables (USD 105 billion); Dairy Products (USD 98 billion); Food Preparations (USD 93 billion) and Soybeans (USD 93 billion). The ninth- and tenth-most traded commodities were cereals, specifically Wheat (USD 59 billion) and Maize (USD 53 billion).
The prominence of meat exports reflects sustained global demand, particularly for poultry, beef and pork. Fruit exports are dominated by high-value items such as tropical fruits, apples and bananas. Beverages encompass diverse products, including coffee, tea, wine and spirits.
The U.S. is the world’s largest agricultural exporter by value, with exports in 2023 totalling USD 171 billion; it is also the second-largest importer at USD 195 billion, behind China (USD 214 billion), the seventh-largest exporter.
Among the ten largest exporters are Brazil and Canada in the Americas, and the Netherlands, Germany, France, Spain, Italy and Belgium in Europe. Apart from Brazil and Canada, these countries also comprise the world’s ten largest agricultural importers, alongside the U.K. and Japan.
Agricultural Supply Chains in 2025 and Strategic Implications for Agri Businesses and Players in the Sector
Given the global agricultural production and trade data presented above, the following are preliminary strategic implications for agribusiness executives in logistics, food processing, retail and trade industries to navigate the evolving supply chain landscape in 2025 and beyond.
- Global food supply is highly vulnerable to geopolitical shocks: Several key staple crops are concentrated in a small number of countries, such as soybeans (Brazil, U.S.), wheat (China, India, Russia) and rice (China, India). These concentrations expose the entire system to geopolitical shocks and trade barriers in a handful of countries.
Implications: Executives must assume that regional disruptions will impact the global supply of key agricultural commodities, necessitating more robust sourcing diversification and scenario planning.
- Rising import dependency in Africa and Asia creates risk and potentially great rewards: Asia is a net-importing region for all food categories, and Africa for all categories except fruit & vegetables. This overwhelming import dependency requires more extended and fragile supply chains, which are especially vulnerable to rising freight costs, port disruptions and currency volatility. At the same time, this import dependency opens up historic market opportunities for agribusiness executives who can reliably serve growing populations in Africa and Asia with their rising demand for protein, convenience, safety and traceability.
Implications: Risk is structural, but reward can be exponential for agricultural suppliers that invest not just in supply, but in resilient, regionalised and value-added delivery systems for Asia and Africa.
- Shifting trade routes and strategic alliances demand a new playbook: Important bilateral agricultural trade flows are shifting, notably China replacing U.S. with Brazilian supply of soybeans, and the decrease in Russia-Europe trade from 2022. Agricultural trade is shifting from static trade routes to more dynamic, multi-corridor trade ecosystems that can provide suppliers and traders with the means to reach the next billion consumers.
Implications: Executives must reduce exposure to regions with trade tensions, and increase direct trade corridors with emerging exporters and importers in countries such as Brazil, India, Indonesia, Vietnam and Türkiye, setting up in-country logistics and trade facilitators with regional hubs or partner facilities.
- Technology gaps and market entry barriers in Africa require a strategic approach: Africa is one of the most significant untapped agricultural demand regions with growing populations, rising urbanisation and increasing food import dependency. However, lagging productivity in parts of Africa means that market expansion will depend on significant investment to bridge the technology adoption gap, and dealing with other challenges such as fragmented markets, inconsistent regulation and logistical and infrastructure constraints.
Implications: Africa’s agricultural opportunity is real, but only for executives willing to employ a long-term strategy to invest, localise and partner in building farming ecosystems.
- Climate volatility is now a fundamental variable for agricultural production and trade: The increasing frequency and intensity of droughts, heatwaves and floods, particularly in key food-producing countries such as Brazil and India, pose a direct and potentially debilitating threat to crop production and trade.
Implications: Executives must shift from reactive to resilience-based strategies, including investing in climate-linked procurement systems and climate risk assessments.
- Recent trade trends highlight changing consumer preferences: Sustained high global demand for meat, fruit, beverages and processed food preparations illustrates a transition towards higher-value, convenience-oriented consumer preferences. High demand for these products by middle-class consumers in Asia, the Middle East and Africa provides a strategic opening for executives to move up the value chain, enter premium segments and build regional dominance.
Implications: Food processing, retail and logistics executives must align sourcing and product development with value-added and perishable segments, and upgrade cold chain and traceability infrastructure. Other essential steps will be to localise processing and packaging near demand hubs, invest in premium branding and certifications and establish long-term offtake agreements with retailers.
ANDAMAN PARTNERS supports international business ventures and growth. We help launch global initiatives and accelerate successful expansion across borders. If your business, operations or project requires cross-border support, contact connect@andamanpartners.com

ANDAMAN PARTNERS Wishes You a Happy and Prosperous Year of the Horse!
Compliments of the Chinese Lunar New Year to all our clients, customers, suppliers and partners.

ANDAMAN PARTNERS to Attend Investing in African Mining Indaba 2026 in Cape Town
ANDAMAN PARTNERS Co-Founders Kobus van der Wath and Rachel Wu will attend Investing in African Mining Indaba 2026 in Cape Town, South Africa.

Join ANDAMAN PARTNERS at Networking Event in Cape Town Ahead of Mining Indaba 2026
ANDAMAN PARTNERS is pleased to support and sponsor this popular Pre-Indaba event in Cape Town.
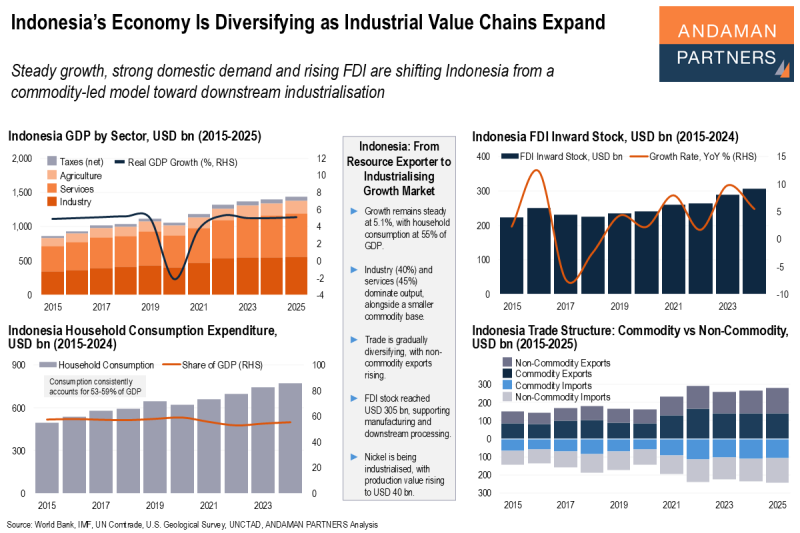
Indonesia’s Economy Is Diversifying as Industrial Value Chains Expand
Steady growth, strong domestic demand and rising FDI are shifting Indonesia from a commodity-led model toward downstream industrialisation.
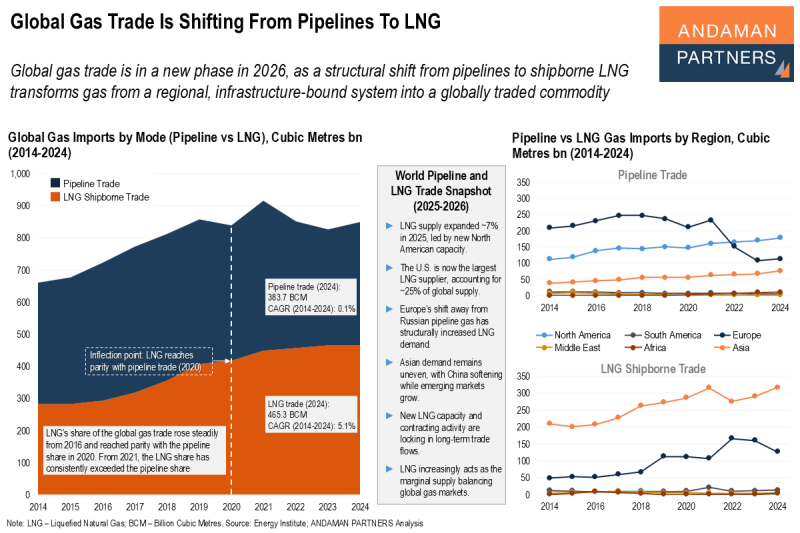
Global Gas Trade Is Shifting from Pipelines to LNG
Global gas trade is in a new phase in 2026 amid a structural shift from pipelines to shipborne LNG.
Global Car Markets and the Uneven Transition to Electric Vehicles
Global passenger car sales reached 92 million units in 2025, including more than 20 million EVs, but adoption varies widely across markets.