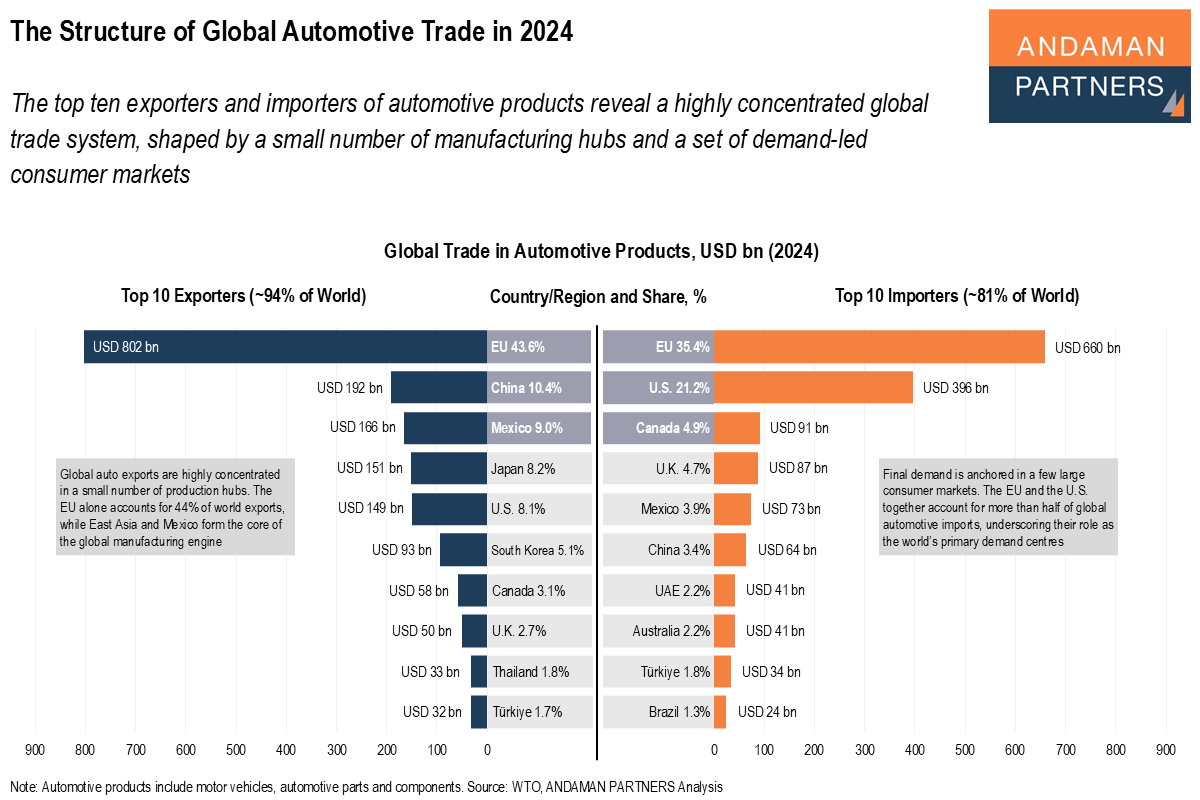
The Structure of Global Automotive Trade in 2024
The top ten exporters and importers of automotive products reveal a highly concentrated global trade system.

The top ten exporters and importers of automotive products reveal a highly concentrated global trade system.
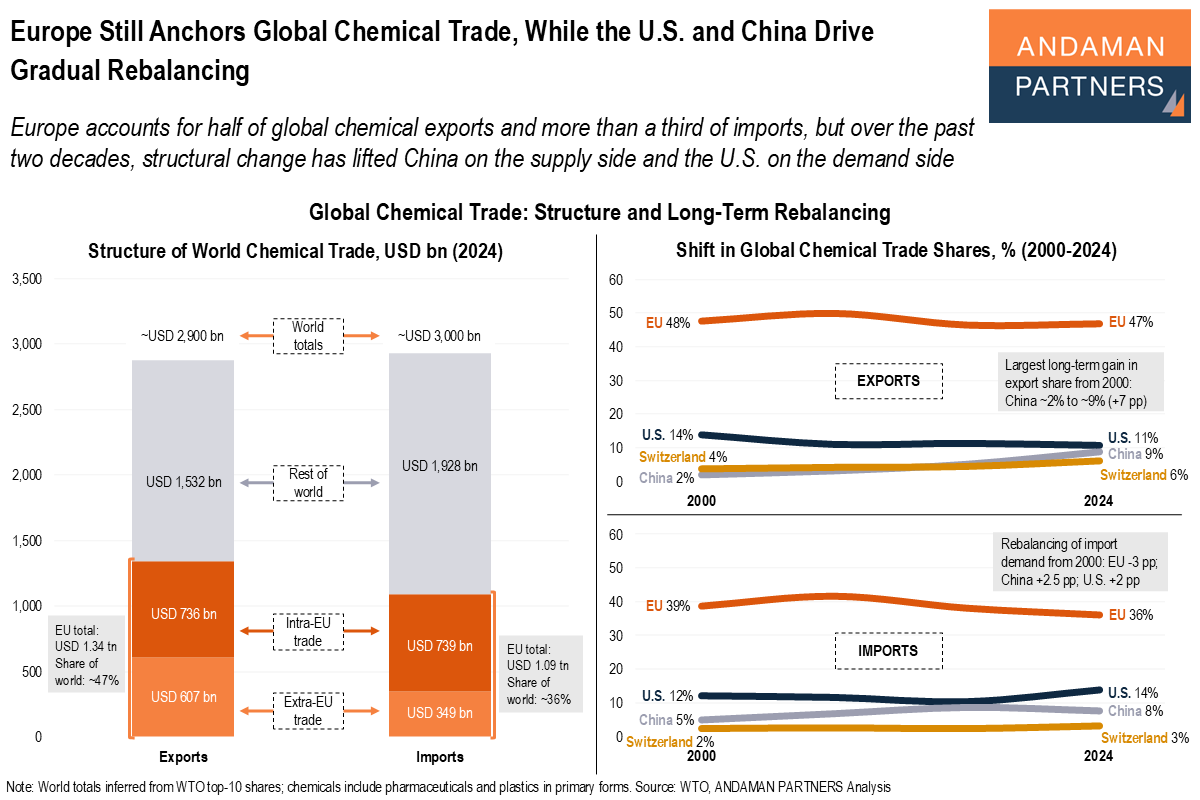
Europe accounts for half of global chemical exports and more than a third of imports, but over the past two decades, structural change has lifted China and the U.S.
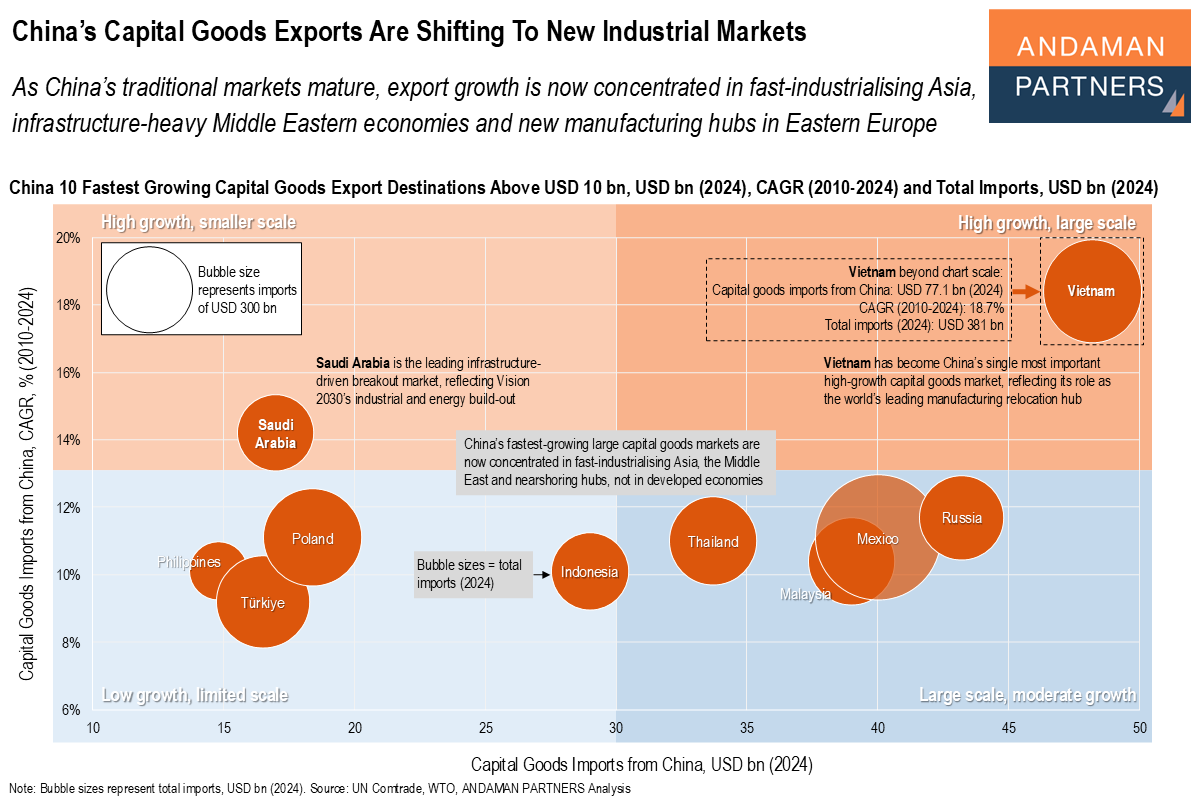
Export growth is now concentrated in fast-industrialising Asia, infrastructure-heavy Middle Eastern economies and new manufacturing hubs in Eastern Europe.
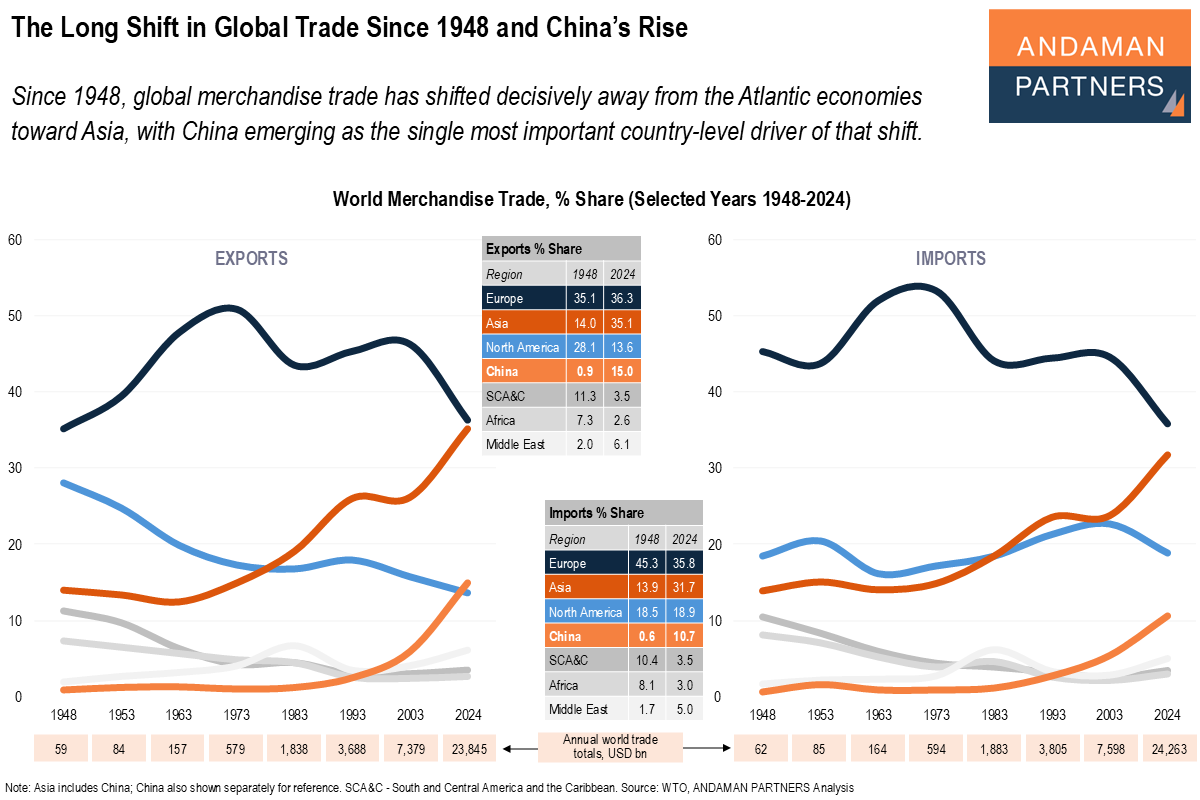
Since 1948, global merchandise trade has shifted decisively away from the Atlantic economies toward Asia.
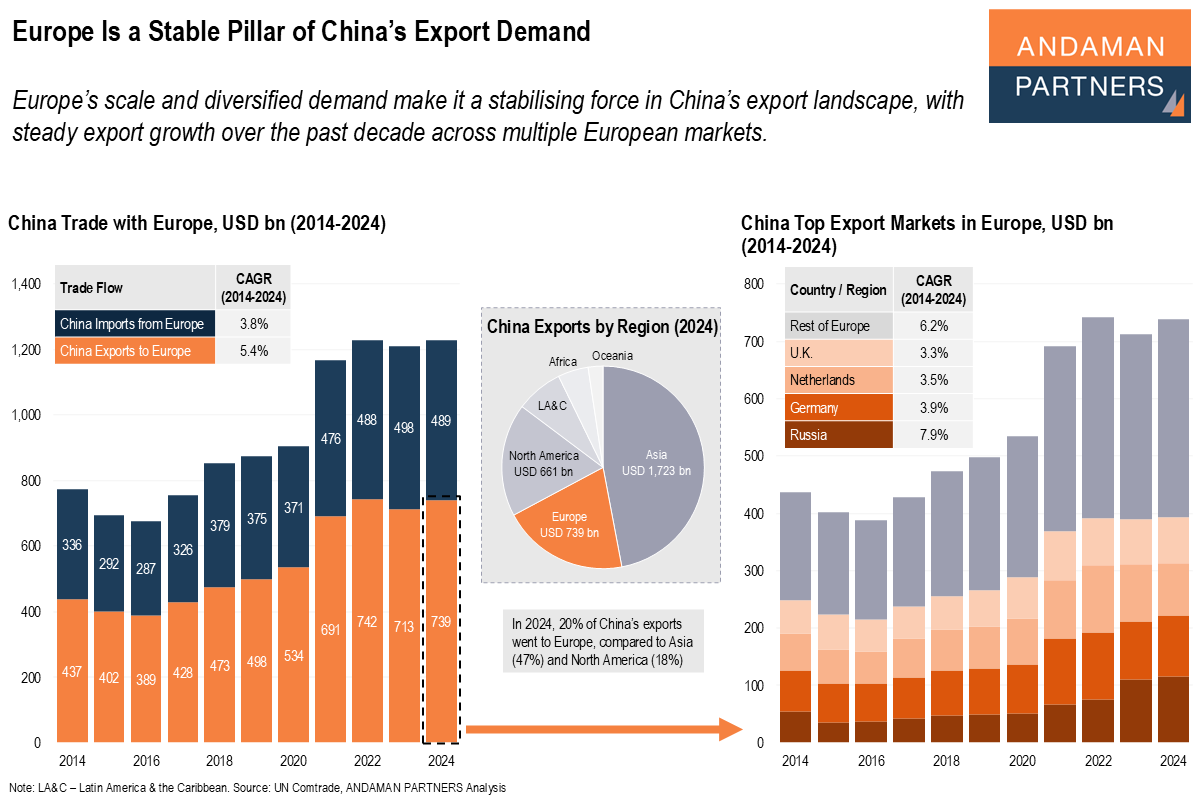
Europe’s scale and diversified demand make it a stabilising force in China’s export landscape, with steady export growth over the past decade.
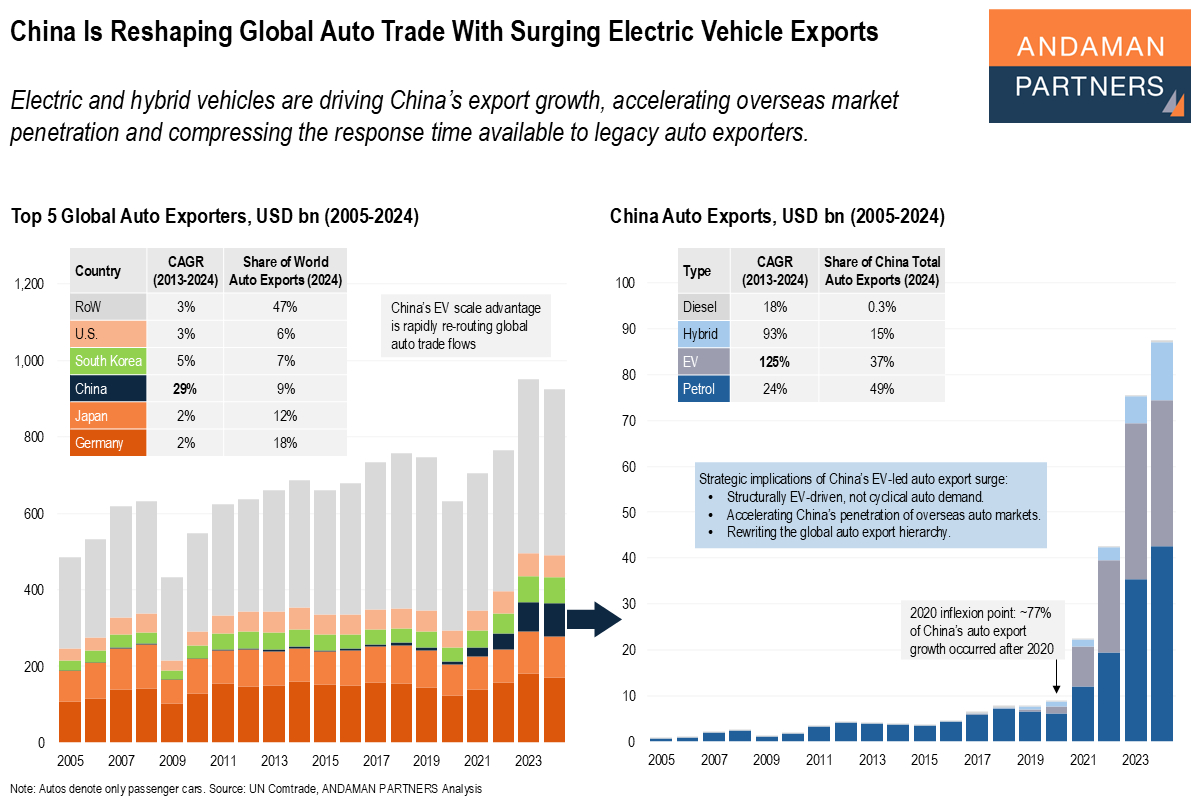
Electric and hybrid vehicles are driving China’s export growth, accelerating overseas market penetration and compressing the response time available to legacy auto exporters.
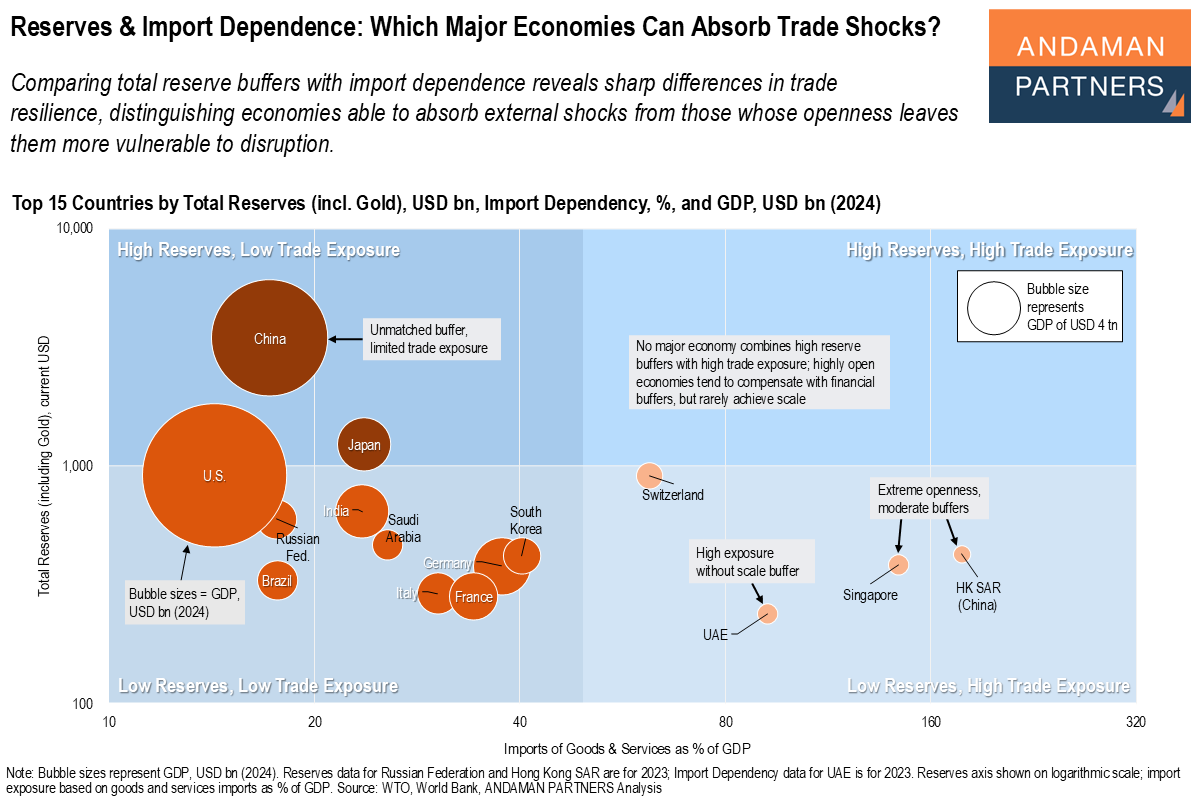
Comparing total reserve buffers with import dependence reveals sharp differences in trade resilience among major economies.
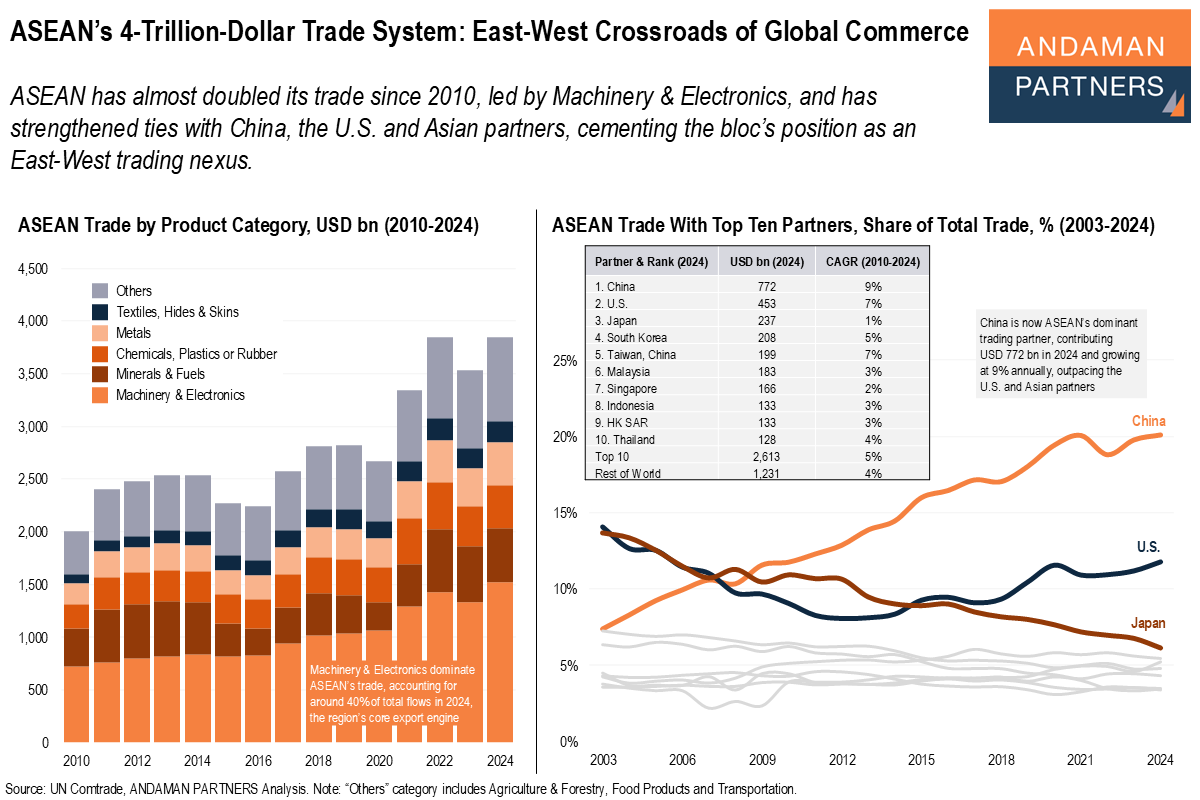
ASEAN has almost doubled its trade since 2010 and has strengthened ties with China and the U.S., cementing the bloc’s position as an East-West trading nexus.
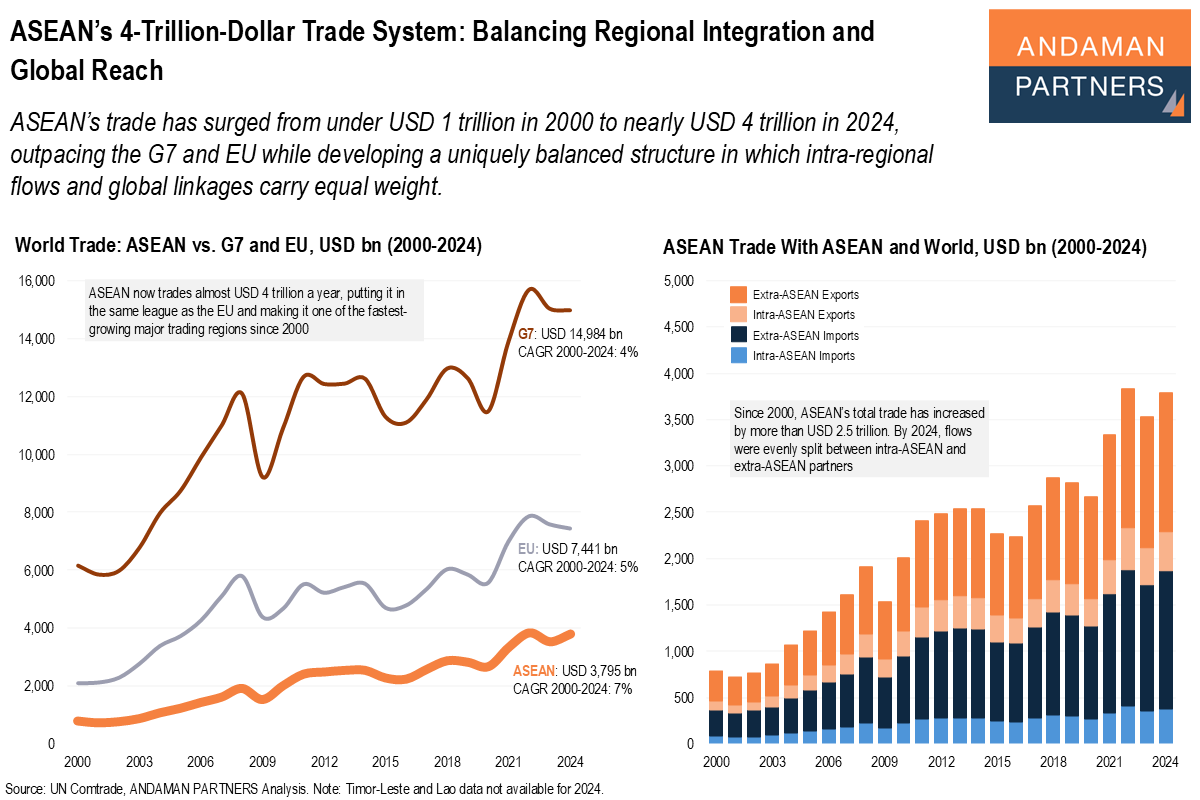
ASEAN’s trade has surged to nearly USD 4 trillion in 2024 while developing a uniquely balanced structure.
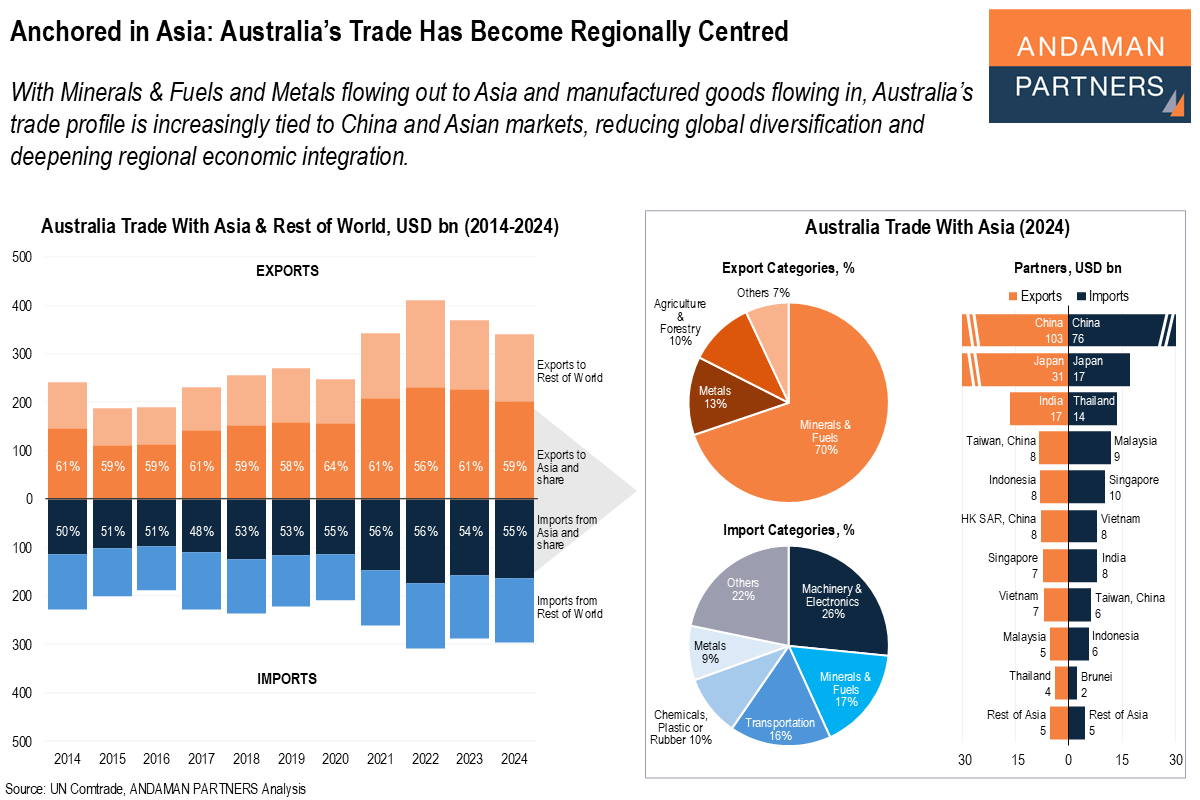
With Minerals & Fuels and Metals flowing out to Asia and manufactured goods flowing in, Australia’s trade profile is increasingly tied to China and Asian markets.