ANDAMAN PARTNERS Maps the Global Trade of Fossil Fuels
In the global trade of fossil fuels, resource-rich economies such as the U.S., Canada, Norway and Australia loom large on the export side, while resource-hungry Asian economies, notably China, India, South Korea and Japan, anchor demand.
Few Sellers
Global energy exports in 2024 were highly concentrated, with a handful of countries accounting for the majority of flows. This concentration gives suppliers outsized influence over pricing, trade flows and geopolitics.
- Coal: Australia and Indonesia accounted for 65% of global exports (USD 147.6 billion), and the top five exporters, including the U.S., Canada and Colombia, accounted for 85%.
- Natural Gas: The U.S., Norway and Australia made up 59% of global exports (USD 275 billion), and the top five, including Malaysia and Belgium, accounted for 68%.
- Crude Oil: Global exports totalled USD 749 billion; Saudi Arabia, the U.S. and Canada supplied 54%, with Saudi Arabia alone at nearly a quarter of the total (24%). The top five, including Norway and Brazil, accounted for 66% of exports.
- Refined Petroleum: Exports were more dispersed but still concentrated; the top three exporters (the U.S., India and the Netherlands) accounted for 36% of global exports (USD 568 billion), and the top five exporters, including South Korea and China, accounted for 49%.
Energy-Hungry Asia
Imports are spread across a broad base of resource-hungry economies, especially in Asia, reinforcing shared exposure to a more concentrated set of suppliers. China was the leading importer of coal, gas and crude oil, and Asian economies feature very prominently among the world’s five largest fossil fuel importers.
- Coal: China accounted for 27% of global imports, and the top three, with India and Japan, accounted for 59%. The top five, with South Korea and Germany, accounted for 71%.
- Natural Gas: China accounted for 19% of global imports. The top three, including Japan and South Korea, accounted for 37%, and the top five, including India and France, accounted for 49%.
- Crude Oil: China was the largest importer, accounting for a quarter of global exports (25%), and the top three, with the U.S. and India, accounted for 49%. The top five, with South Korea and Japan, accounted for 61% of total imports.
- Refined Petroleum: The U.S was the largest importer at a share of 8%, and the top three, with Singapore and France, accounted for 19%. The top five, including Australia and the Netherlands, accounted for 27% of the market, indicating that demand for refined petroleum is particularly diffuse.
Also by ANDAMAN PARTNERS:
ANDAMAN PARTNERS supports international business ventures and growth. We help launch global initiatives and accelerate successful expansion across borders. If your business, operations or project requires cross-border support, contact connect@andamanpartners.com.
Media

AAMEG Sundowner Event in Cape Town Ahead of Mining Indaba 2026
ANDAMAN PARTNERS is pleased to sponsor and support the AAMEG Pre-Indaba Cocktail.

ANDAMAN PARTNERS to Attend Future Minerals Forum 2026 in Riyadh, Saudi Arabia
ANDAMAN PARTNERS Co-Founders Kobus van der Wath and Rachel Wu will attend the Future Minerals Forum (FMF) in Riyadh, Saudi Arabia.

ANDAMAN PARTNERS to Attend Investing in African Mining Indaba 2026 in Cape Town
ANDAMAN PARTNERS Co-Founders Kobus van der Wath and Rachel Wu will attend Investing in African Mining Indaba 2026 in Cape Town, South Africa.

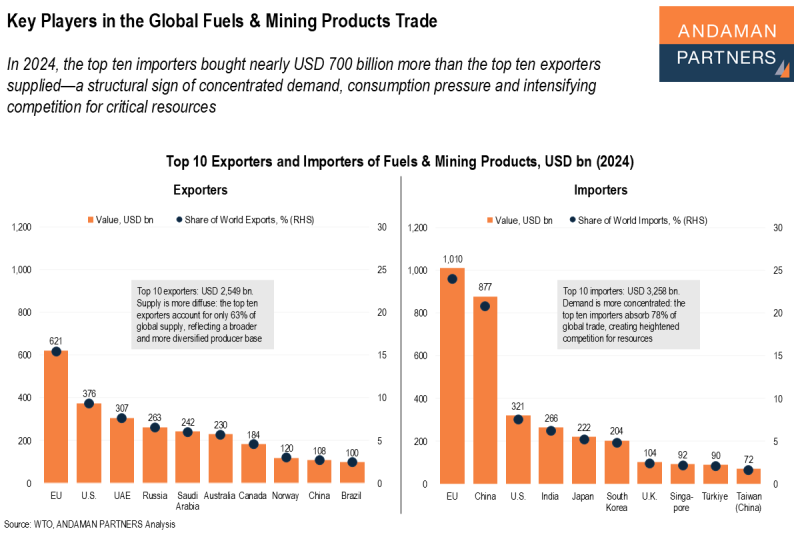
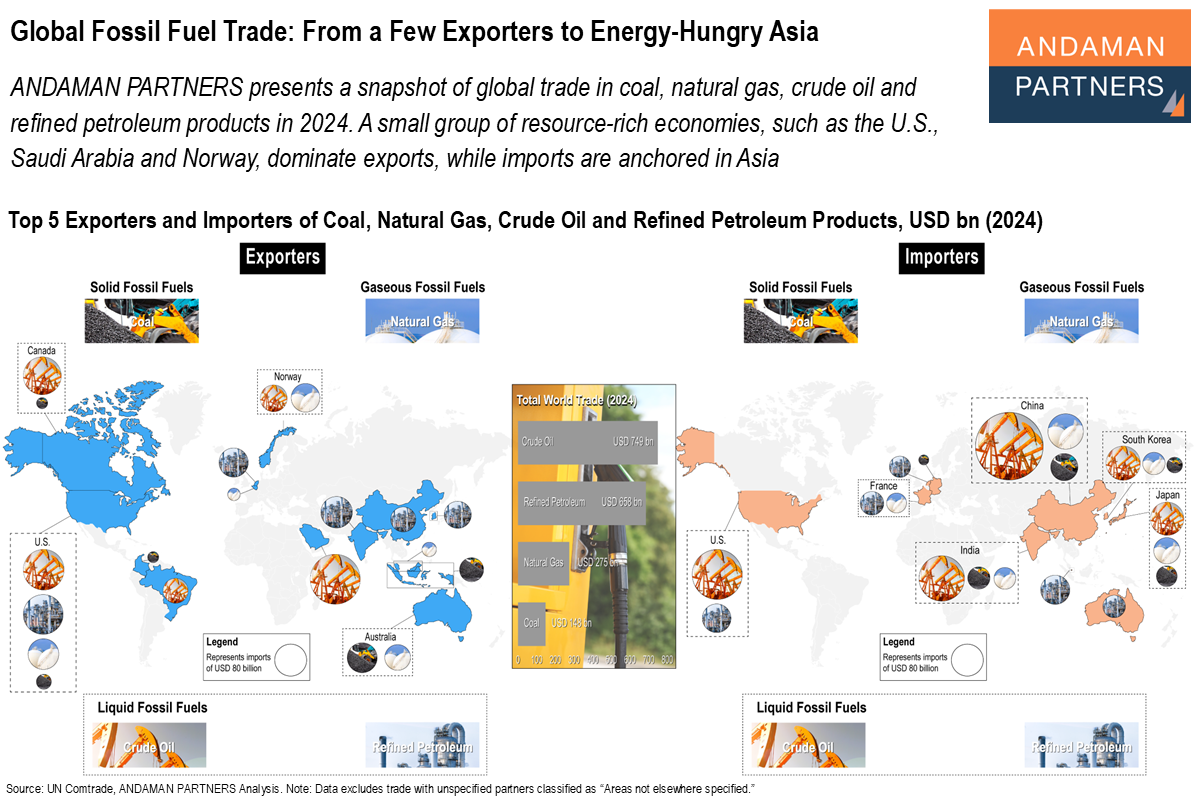
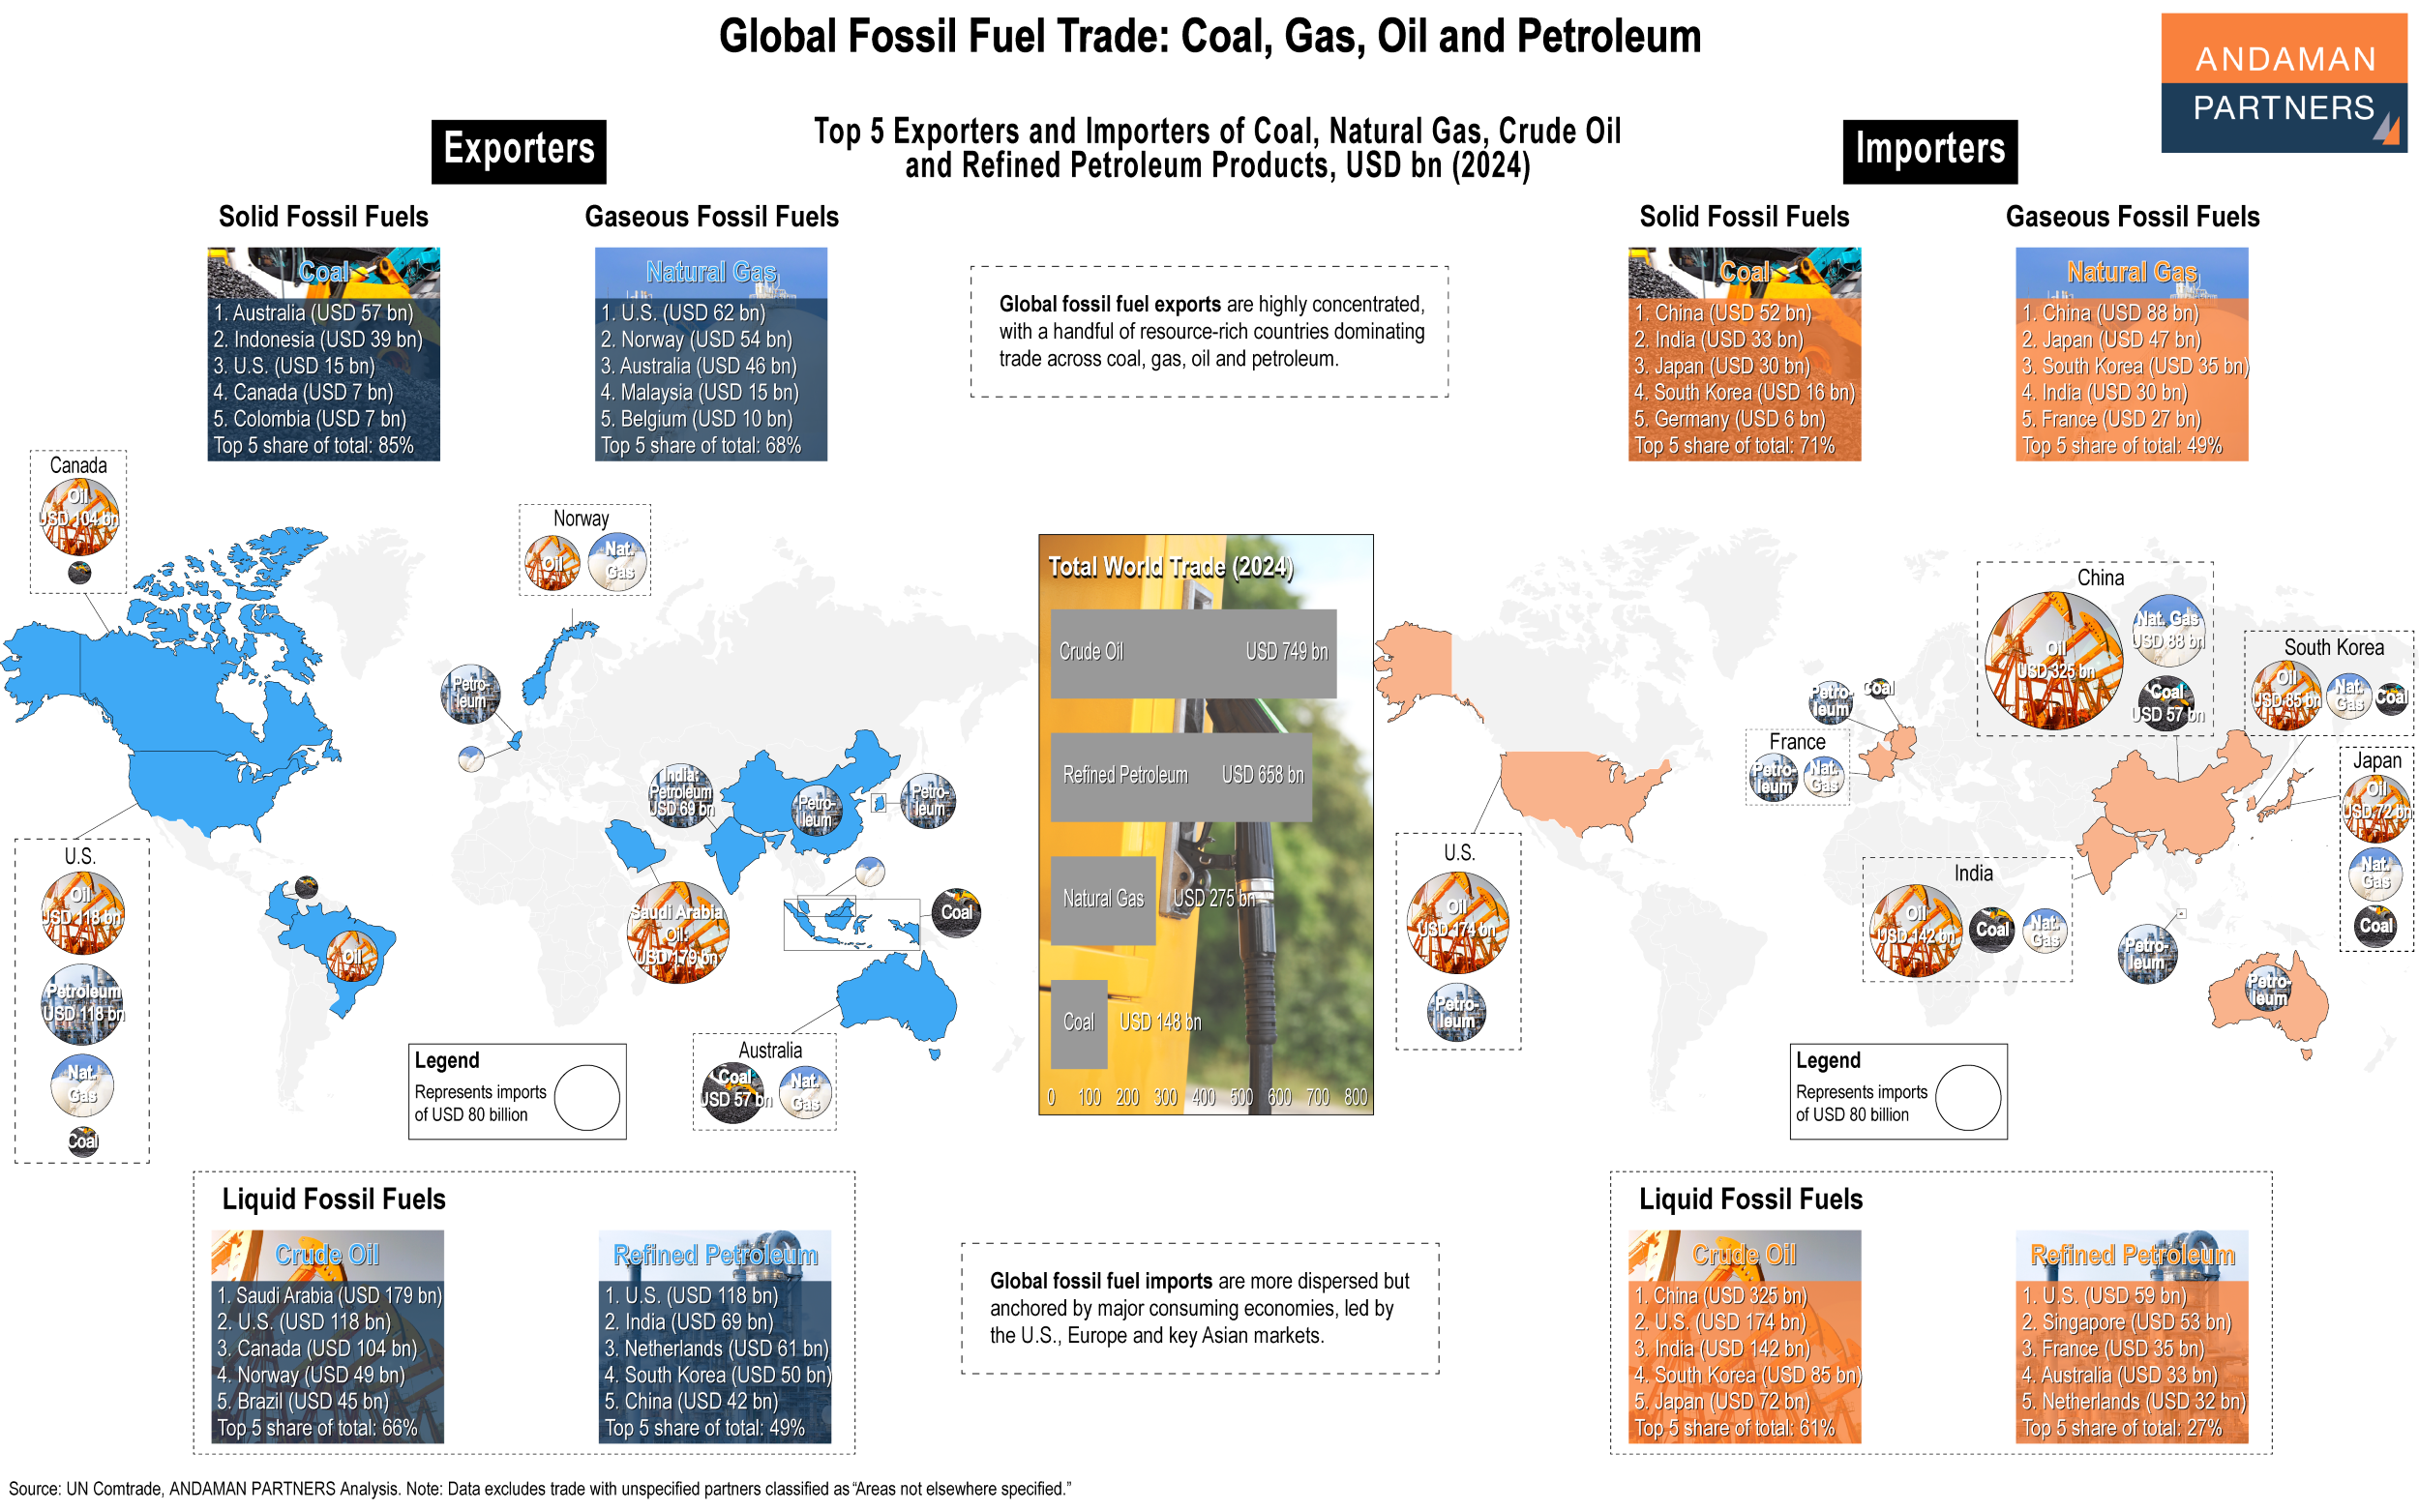
Key Players in the Global Fuels & Mining Products Trade
In 2024, the top ten importers bought nearly USD 700 billion more than the top ten exporters supplied.

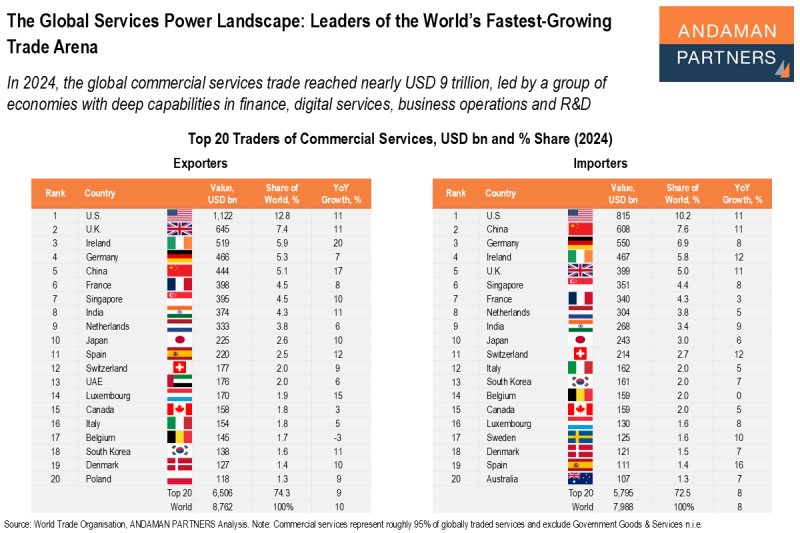
The Global Services Power Landscape: Leaders of the World’s Fastest-Growing Trade Arena
In 2024, the global commercial services trade reached nearly USD 9 trillion, led by a group of economies with deep capabilities.

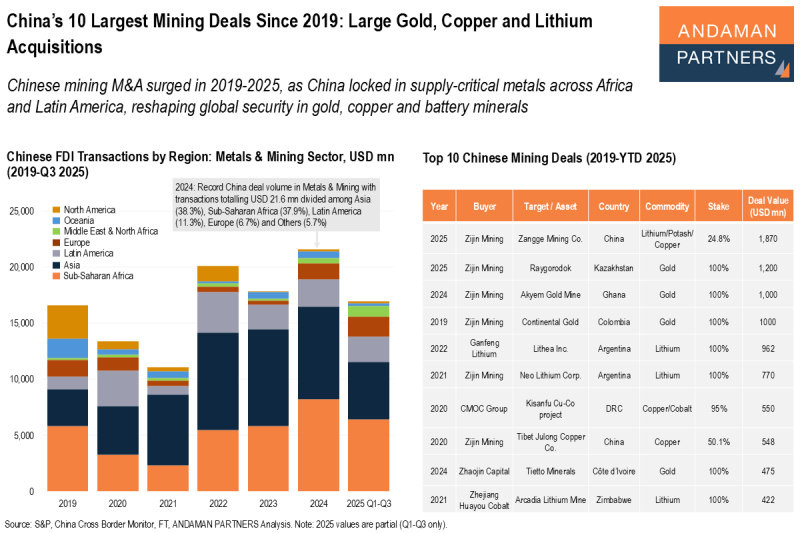
China’s 10 Largest Mining Deals Since 2019: Large Gold, Copper and Lithium Acquisitions
Chinese mining M&A surged in 2019-2025, as China locked in supply-critical metals across Africa and Latin America.